An automated Python script to download and update NSE stocks, indices, and delivery data.
Stock Data is stored as CSV files and adjusted for splits and bonuses. Ideal for use in backtesting.
If you ❤️ my work so far, please 🌟 this repo.
The old plot.py and plot_breadth.py scripts have been combined into a single entry point—chart.py—along with a redesigned CLI, new indicator plugins, improved drawing tools, and several quality-of-life improvements.
- See the full announcement
- Wiki Using chart.py
- Wiki Plugins in chart.py
- Wiki AI‐Powered Market Indicator Plugin Generation
- Wiki Article: Market Breadth Indicators: Reading the Market Beneath the Index
EOD2 now includes a dedicated market breadth module that helps analyze overall market participation and underlying trend strength beyond individual stocks. See Using chart.py - Plot market breadth for usage.
- Advance-Decline Line
- Percentage of stocks above 50-day and 200-day moving averages
- McClellan Ratio-Adjusted Oscillator
- Net 52-week cumulative highs
market_breadth_sync.pySyncs breadth indicators on a daily basis
These indicators measure the participation and strength of the broader market, helping confirm trends, identify divergences, and assess the underlying health of price movements.
src/eod2_data/dailycontain OHLC and delivery data for individual stocks.- A list of available indices can be found in
src/eod2_data/sector_watchlist.csv. - Supports Python version >= 3.8
👽 Installation, Usage, and Other Details - See Wiki
I just opened GitHub discussions. Connect with other members and share your thoughts, views, and questions about EOD2.
- Daily EOD data for over 2000 NSE stocks since 1995.
- Stores OHLCV and delivery data of individual stocks and indices in csv files.
- Automatically syncs data up to the current date while keeping track of NSE holidays.
- Makes historical adjustments for splits and bonuses.
- Keeps track of stock ISIN for changes in company/symbol code and applies changes.
- Prints colored alerts when NIFTY PE is below 20 and above 25.
- Works cross platform (Linux, Windows, Mac).
- Robust error handling mechanisms to protect data.
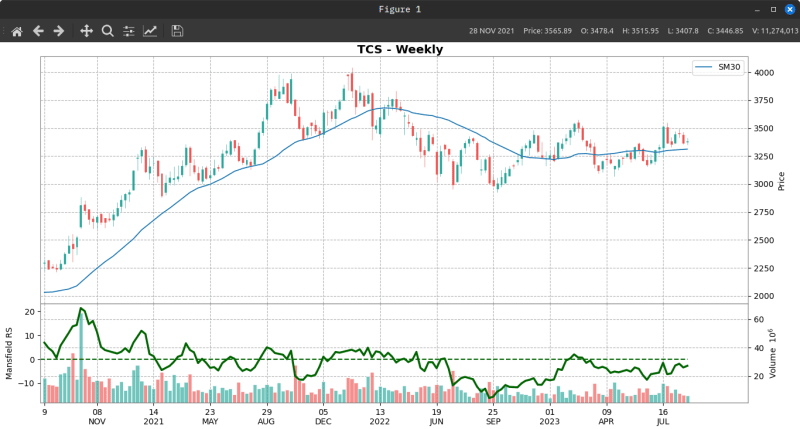
- Add volume, sma, ema and stock Relative strength analysis.
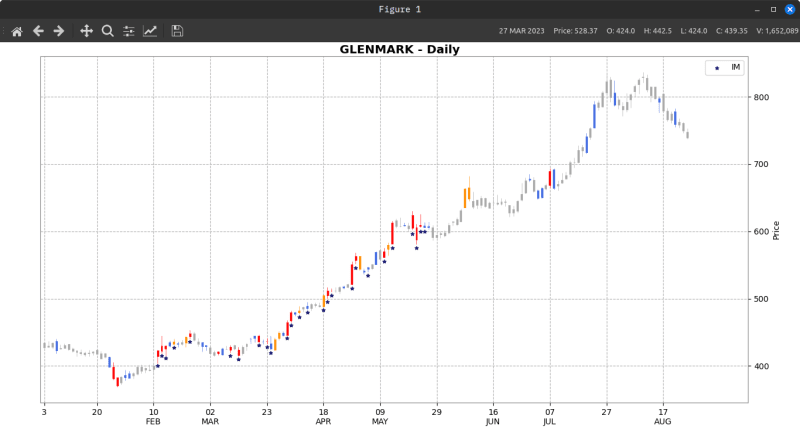
- Perform analysis on weekly or daily charts.
- Detects support and resistance levels and plots them on the chart.

BennyThadikaran/RRG-Lite - RRG-Lite is a Python CLI tool for displaying Relative Rotational graph (RRG) charts.
BennyThadikaran/stock-pattern - A python scanner to detect and plot stock chart patterns