




A cross-platform remote monitoring tool written in Go that exposes system and hardware information (CPU, RAM, disks, network, processes, and more) through a JSON API, so it can be consumed by web admin panels, mobile apps, or anything that speaks HTTP.
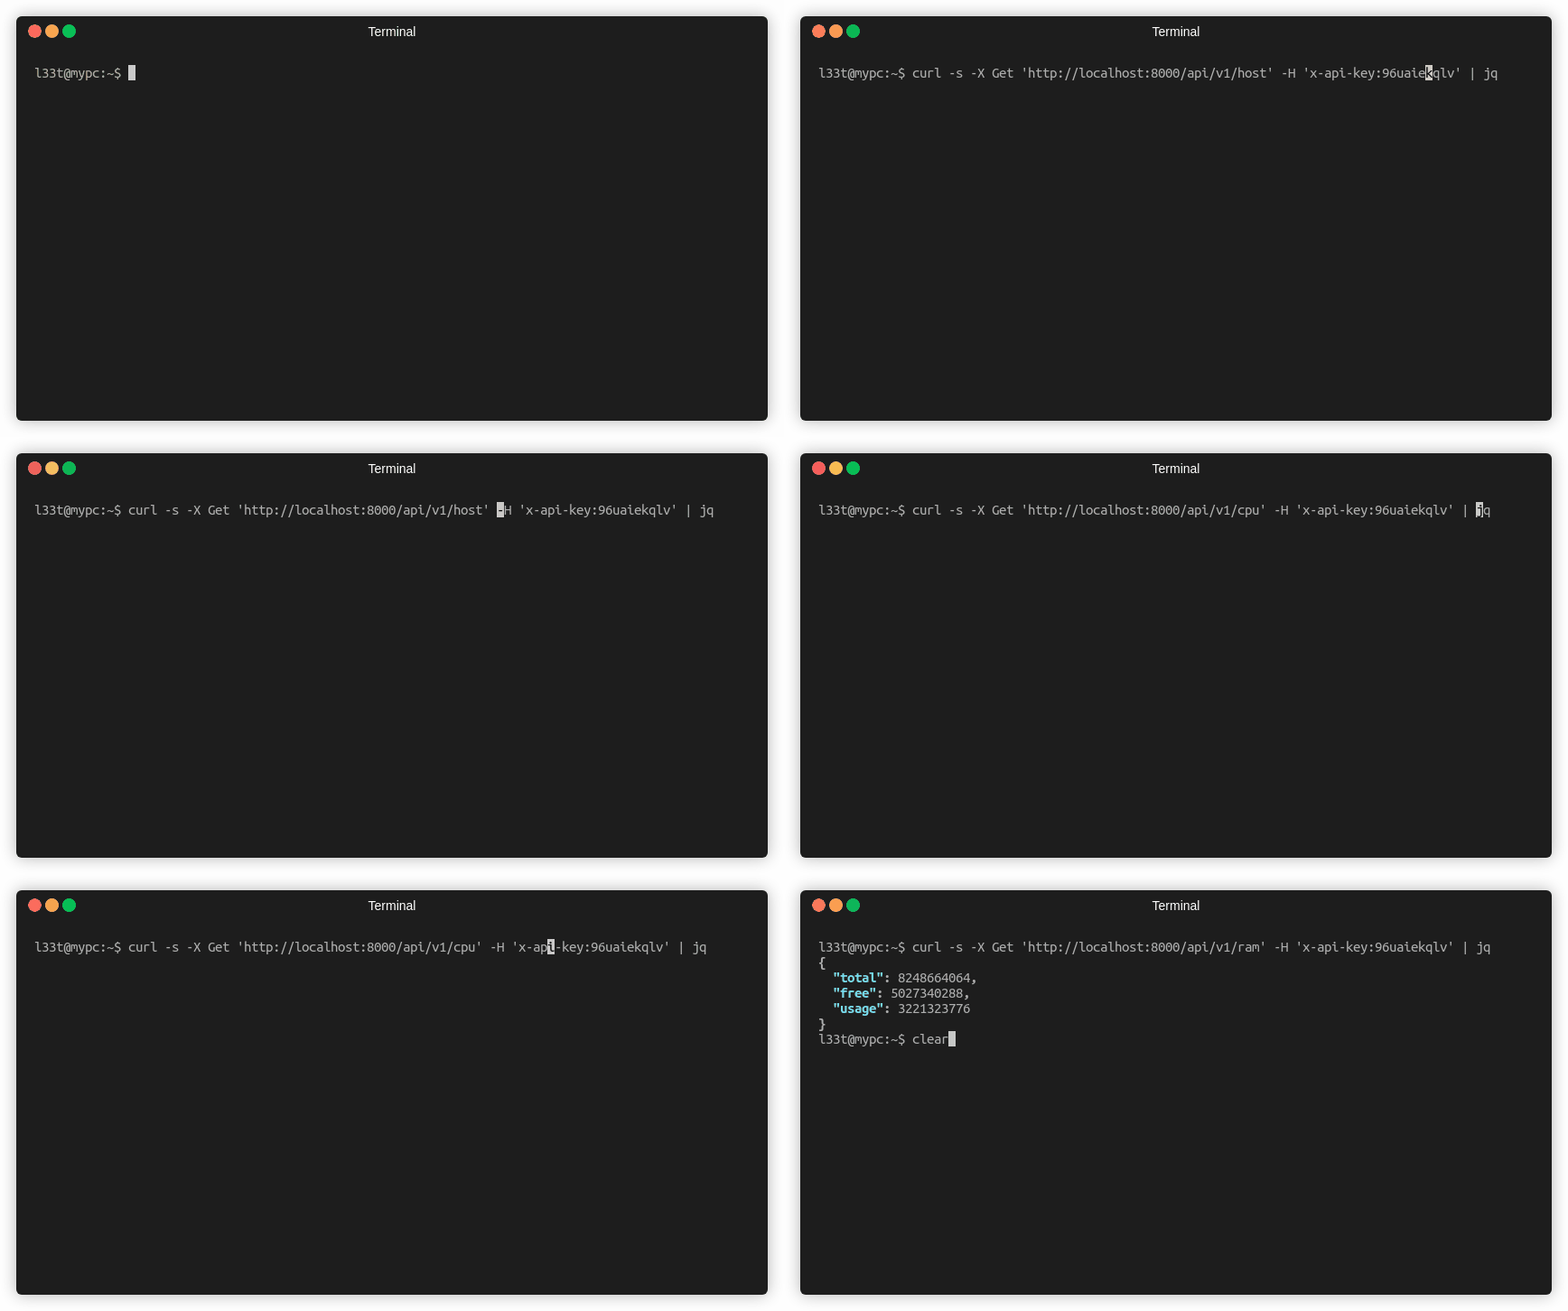
CLI demo — basic system info, no API key required
Quick start:
# Linux — detects your arch, downloads, chmods, verifies the binary runs
curl -fsSL https://raw.githubusercontent.com/bitcav/nitr/master/install.sh | bash
The installer downloads into the current directory — nothing is placed on your PATH. Run it as ./nitr from here, or make it available globally with sudo mv nitr /usr/local/bin/nitr.
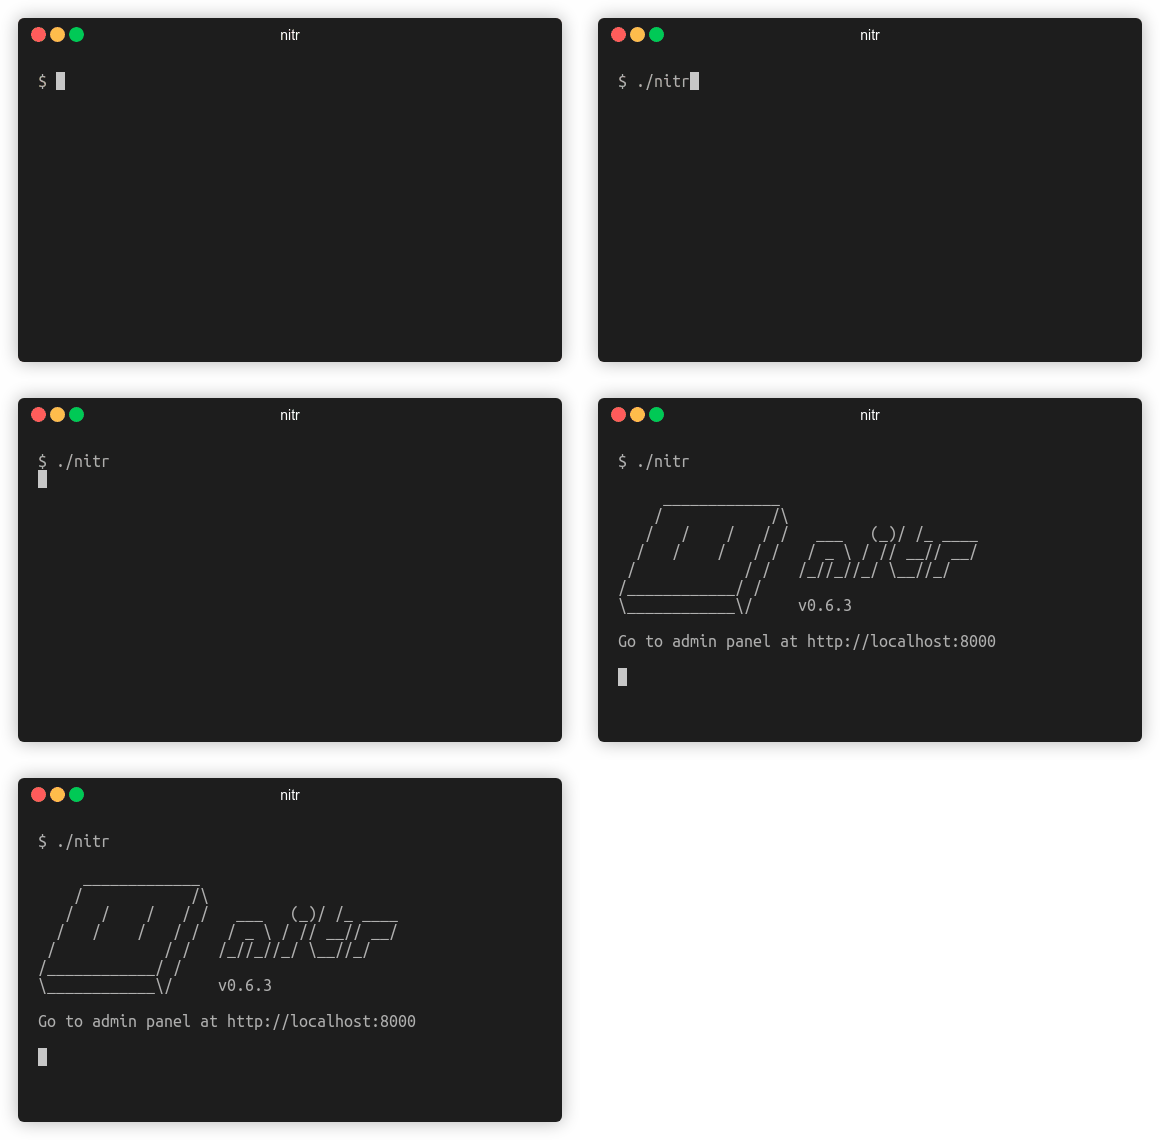
./nitr          # starts the server in the foreground (default port 8000)
                # and creates nitr.db + config.ini in this directory
./nitr blocks here — the server is running. The commands below need nitr.db, so they only work once the server has run in this directory. Run them in a second terminal in the same directory, or after stopping the server with Ctrl+C:
./nitr passwd   # change the default password before going further
./nitr key      # print your API key (prompts for the password)
See Usage for how to call the API with that key.
- Installation
- Running
- Commands
- Docker
- Web panel
- QR Code
- Usage
- HTTP behaviour
- Prometheus metrics
- Health and readiness probes
- API v1
- Settings
- Platform support
- Powered by
Linux (amd64/386/arm64) — get the binary via the install.sh one-liner from the top of this README, or fetch it directly:
curl -L https://github.com/bitcav/nitr/releases/latest/download/nitr_linux_amd64 -o nitr
chmod +x nitr
Windows (amd64) — PowerShell
Invoke-WebRequest https://github.com/bitcav/nitr/releases/latest/download/nitr_windows_amd64.exe -OutFile nitr.exe
On 32-bit systems, swap the asset name for
nitr_linux_386ornitr_windows_386.exe.
https://github.com/bitcav/nitr/releases/latest
Note: go version 1.26 or higher is required building it from the source.
git clone https://github.com/bitcav/nitr.git
cd nitr
go build
Linux
./nitr
Windows You can double click the .exe file or type in cmd
nitr.exe
the server will start listening on port 8000 by default
It writes nitr.db and config.ini to the current working directory — always start it from the same directory you own.
A few endpoints require root on Linux: /memory outright, the serial field on /chassis and /baseboard, and the serial/uuid fields on /product. Without it they return unknown fields (403 for /memory). Full per-endpoint privilege notes are in docs/openapi.json (or rendered at /docs in the panel) — see JSON data references.
Both spellings — bare nitr and the explicit nitr server — start the server. Bare nitr is not deprecated: the Dockerfile's CMD and the Windows double-click flow above rely on it, and it stays the zero-argument default. nitr server is the self-documenting form (it is what nitr --help lists, what the installed system service's ExecStart invokes, and what reads clearly in a process list) and accepts the same persistent flags as the root command, e.g. nitr server --port 9000.
Help:
nitr -h
Print the version:
nitr version
Change password:
nitr passwd
Get API key:
nitr key
Print QR code:
nitr qr
nitr passwd,nitr key, andnitr qroperate on the database in the current working directory and need the server to have been started there first — running the server is the only thing that createsnitr.db. Without it they refuse and exit 1, creating nothing:Error: no nitr database found at /path/to/nitr.db — start the nitr server there first
Build image using command:
docker build -t nitr .
Run container:
docker run -d -p 8000:8000 nitr:latest
The image ships a HEALTHCHECK (30s interval, 5s timeout, 10s start period, 3 retries) that runs wget -q -O /dev/null http://localhost:8000/health, so docker ps reports a health status for the container alongside its uptime. /health needs no API key and no login, so the probe works out of the box. The health-status lifecycle is Docker's general HEALTHCHECK behaviour and was not separately observed for this image in the run that added it.
Go to http://localhost:8000 in your web browser
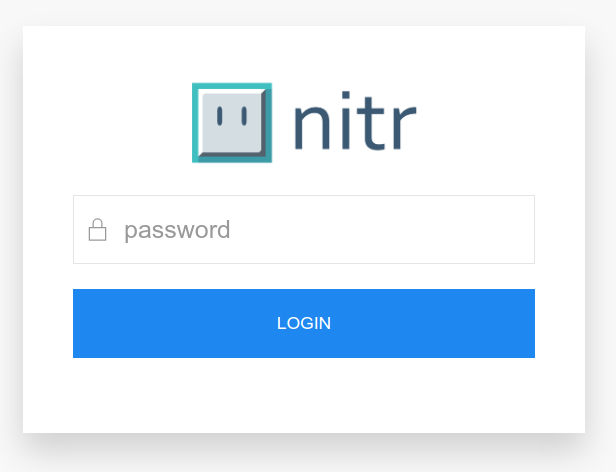
Access with default password: 123456
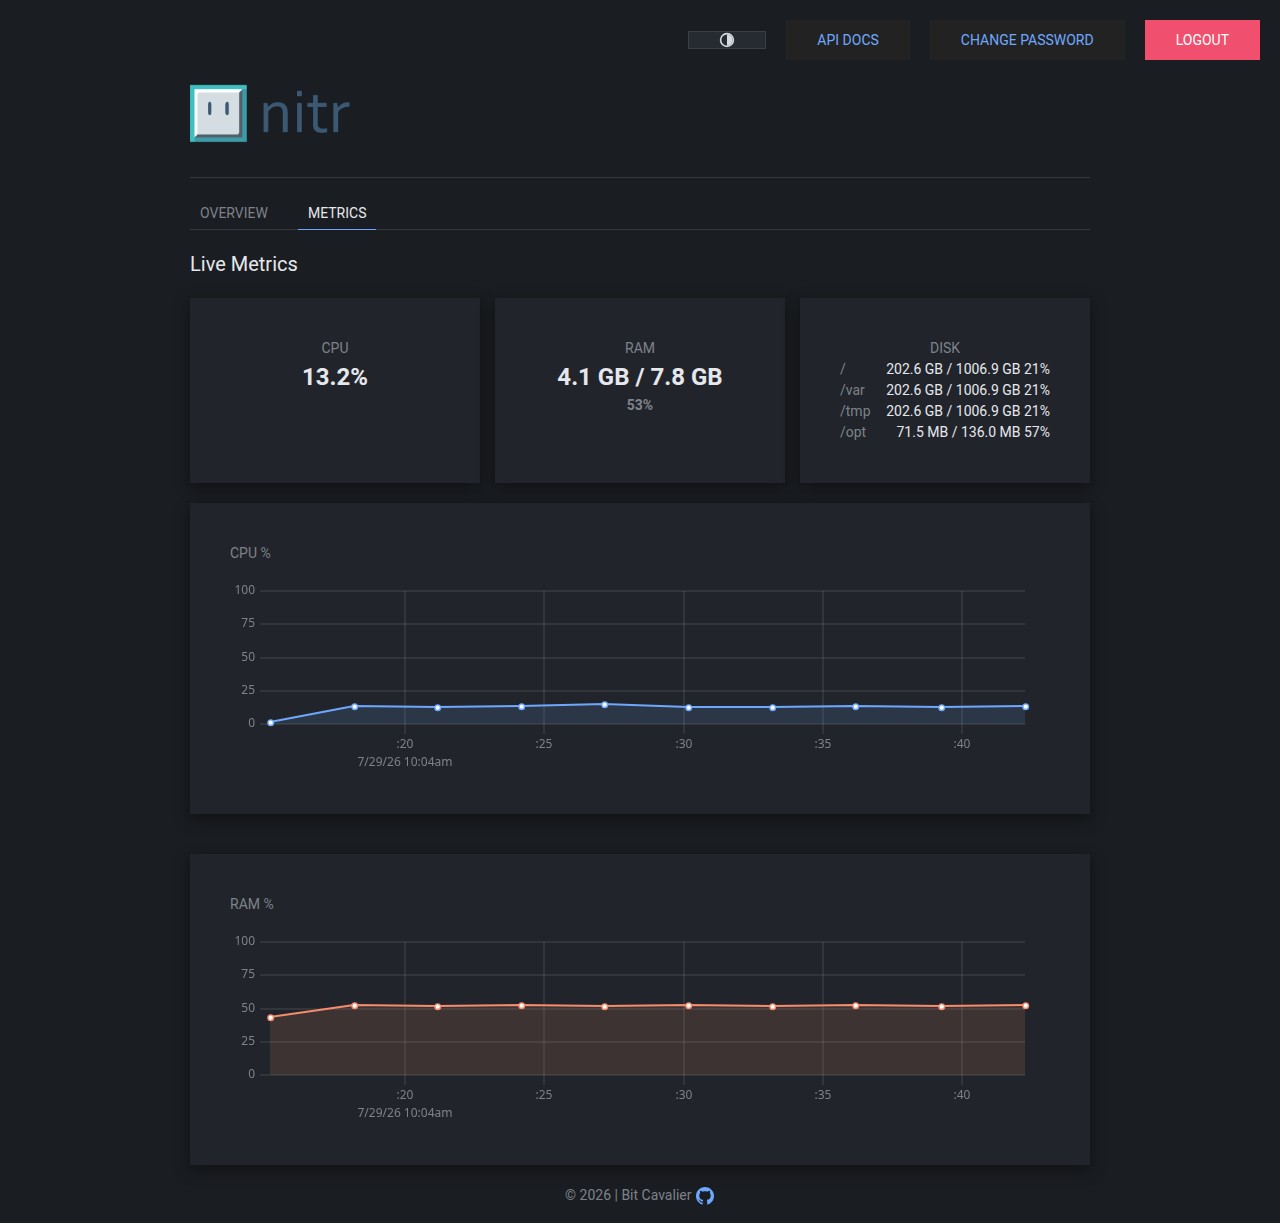
Metrics tab — live CPU, RAM and disk usage (dark theme)
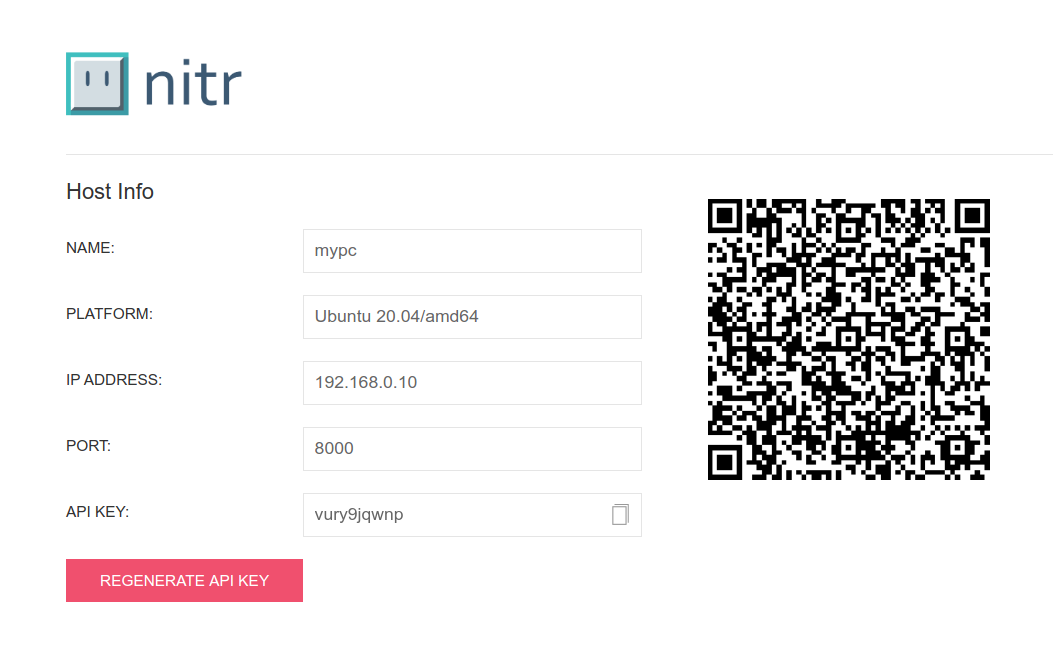
Overview tab — host info, API key and QR code
The panel is organised into two tabs — Overview (host info, API key, QR code) and Metrics — and supports a dark/light theme that follows the OS prefers-color-scheme by default with a manual toggle in the header; the choice is stored in the browser's localStorage and overrides the OS setting in both directions.
The Metrics tab shows live CPU and RAM usage as both numeric widgets and scrolling line charts (driven by the existing /status WebSocket stream). The charts hold session-only history in the browser — roughly the last six minutes (120 samples at the default 3s push), with nothing persisted server-side, so they start empty on every page load. Server-side retention is now available as an opt-in feature — see Metric History Retention — but the panel charts do not consume it.
The layout reflows to a single column on small screens, and pinch-zoom works on mobile clients. The chart library (uPlot) is vendored into the binary — no CDN is used and no build step is required, so the panel keeps working on an air-gapped host.
The QR Code contains the exact same information displayed in the Host Info Panel formatted as JSON.
Request system info with an HTTP GET to one of the API endpoints, passing the x-api-key header with your API key as the value, and you will get a success response.
Requesting CPU information.
With curl.
curl -X GET 'http://localhost:8000/api/v1/cpu' -H 'x-api-key:yourapikeyhere'
With PowerShell.
Invoke-RestMethod -Uri http://localhost:8000/api/v1/cpu -H @{"x-api-key"="yourapikeyhere"}
JSON response:
{
	"vendor":"GenuineIntel",
	"model":"Intel(R) Core(TM) i7-4810MQ CPU @ 2.80GHz",
	"cores":4,
	"threads":8,
	"clockSpeed":3800,
	"usage":8.354430379674321,
	"usageEach":[
				9.803921568623954,
				7.692307692348055,
				4.166666666635087,
				4.166666666698246,
				6.122448979565321,
				6.12244897961267,
				4.081632653074482,
				5.88235294118696
	]
}A few cross-cutting behaviours apply to the server as a whole, regardless of which endpoint is called.
Rate limiting. The login POST / is limited to rate_limit_login_max requests per minute per client IP (default 20), and /api/v1/* together with /metrics to rate_limit_api_max per minute per client IP (default 300). Over the limit, the server answers 429 Too Many Requests — anyone polling the API in a tight loop should expect it and back off. Both limits are configurable; see Settings.
CORS is deny-by-default. A browser client on another origin gets no Access-Control-Allow-Origin header at all unless that origin is listed in cors_origins in config.ini, so a browser-hosted dashboard (Grafana, a custom admin panel) cannot call the API cross-origin out of the box. To allow it, list the origins comma-separated:
cors_origins: https://grafana.example.com, https://dash.example.com
Compression and conditional requests. Responses are gzipped when the client sends Accept-Encoding: gzip, and carry an ETag; a client that repeats a request with If-None-Match gets a 304 Not Modified when the body has not changed, skipping the payload.
Security headers and request IDs. Every response carries baseline security headers (X-Content-Type-Options: nosniff, X-Frame-Options: SAMEORIGIN, Referrer-Policy: no-referrer, and friends) and an X-Request-Id unique to that request. When save_logs is on, the same ID ends each access-log line in nitr.log, so a client-side error report can be matched against the server's log.
Nitr exposes a /metrics endpoint emitting the standard Prometheus exposition format, so Nitr becomes a drop-in scrape target for Grafana, Alertmanager, VictoriaMetrics, and any other monitoring stack that speaks Prometheus.
The endpoint sits behind the same x-api-key header as the JSON API — the exposed data is hardware detail and should not be public. Prometheus passes custom headers through http_headers in scrape_config (secrets: rather than values: so the key is redacted on Prometheus's own config page):
scrape_configs:
  - job_name: nitr
    scheme: http
    metrics_path: /metrics
    static_configs:
      - targets: ["localhost:8000"]
    http_headers:
      x-api-key:
secrets: [yourapikeyhere]All metrics use the nitr_ prefix, base units (seconds, bytes), and snake_case. CPU time is a counter (cumulative); the rest are gauges reflecting host state at scrape time.
| Metric | Type | Labels | Description |
|---|---|---|---|
nitr_cpu_seconds_total |
counter | cpu, mode |
Cumulative CPU seconds per core and mode (user, system, idle...) |
nitr_ram_total_bytes |
gauge | Total RAM in bytes | |
nitr_ram_free_bytes |
gauge | Free RAM in bytes | |
nitr_ram_used_bytes |
gauge | Used RAM in bytes | |
nitr_disk_free_bytes |
gauge | mountpoint |
Free disk space in bytes |
nitr_disk_size_bytes |
gauge | mountpoint |
Total disk size in bytes |
nitr_disk_used_bytes |
gauge | mountpoint |
Used disk space in bytes |
CPU usage is not a separate metric; derive it from the counter with PromQL, e.g. average busy fraction per core over 5m:
1 - avg(rate(nitr_cpu_seconds_total{mode="idle"}[5m])) by (cpu)
Per-interface bandwidth is not exposed yet. bandwidth.Info derives a per-second delta by reading netdev counters twice with a 1s sleep, and a blocking scrape endpoint causes Prometheus scrape timeouts. It will be added once a background sampler lands.
Example scrape with curl:
curl http://localhost:8000/metrics -H 'x-api-key: yourapikeyhere'# HELP nitr_cpu_seconds_total Cumulative seconds the CPU has spent in each mode, per core. Counter; derive utilisation with avg(rate(nitr_cpu_seconds_total[5m])) by (mode).
# TYPE nitr_cpu_seconds_total counter
nitr_cpu_seconds_total{cpu="0",mode="idle"} 1.2345678e+06
nitr_cpu_seconds_total{cpu="0",mode="user"} 3.4567890e+05
# HELP nitr_disk_free_bytes Free disk space in bytes.
# TYPE nitr_disk_free_bytes gauge
nitr_disk_free_bytes{mountpoint="/"} 1.2345678e+07
# HELP nitr_ram_total_bytes Total RAM in bytes.
# TYPE nitr_ram_total_bytes gauge
nitr_ram_total_bytes 8.3319750656e+09
Nitr exposes two unauthenticated probes at the root of the server — GET /health and GET /ready — for Docker, Compose, Kubernetes, and any external uptime checker. Both are registered on the root app before the x-api-key middleware and the panel session auth, so they answer with no API key and no login, and never redirect to the login page. They are deliberately not under /api/v1.
GET /health is the liveness probe. It performs no I/O, touches no collector and no database handle, and cannot fail for reasons unrelated to the process being alive:
curl http://localhost:8000/health
{"status":"ok","version":"0.9.0"}
GET /ready is the readiness probe. It reports 200 only once nitr.db is present at its resolved location (under --data-dir, else the working directory); 503 otherwise:
curl http://localhost:8000/ready
{"status":"ready"}
It does an os.Stat(database.DBPath()) — the resolved nitr.db path, honouring --data-dir — and nothing more. That is a narrow, honest check: it confirms the database file exists — which only happens once the server's setup has run — but it does not confirm bolt can be opened right now, nor that the DB is uncorrupted. If you need a true open-and-read probe, wait for that to land — do not treat /ready as a database-connectivity check, because it is not one.
http://localhost:8000/api/v1
These endpoints return system and hardware information about your host. Check the example for a better understanding.
| Verb | Endpoint |
|---|---|
| GET | / |
| GET | /cpu |
| GET | /bios |
| GET | /bandwidth |
| GET | /chassis |
| GET | /disks |
| GET | /drives |
| GET | /devices |
| GET | /gpu |
| GET | /host |
| GET | /isp |
| GET | /network |
| GET | /processes |
| GET | /ram |
| GET | /baseboard |
| GET | /product |
| GET | /memory |
| GET | /swap |
| GET | /loadavg |
| GET | /sensors |
The four usage-metric endpoints — /cpu, /ram, /disks, /bandwidth — accept ?from=, ?to=, and ?resolution= query parameters when history retention is enabled. With any of them present, the response switches from the instantaneous payload to a series of retained samples, oldest first:
[{"timestamp":"2026-07-29T15:44:28.502661692Z","data":{"vendor":"AuthenticAMD","model":"AMD Ryzen 9 9900X 12-Core Processor","cores":12,"threads":24,"clockSpeed":4391.661,"usage":2.83,"usageEach":["..."]}}]Each data carries the exact payload the endpoint's instantaneous form returns (for /disks and /bandwidth that payload is an array). from and to accept RFC3339 (2026-07-29T03:00:00Z) or bare Unix seconds, and default to the oldest retained sample and now; resolution (seconds, default 0 = every stored sample) thins the series to at most one sample per window, keeping the first sample in each — payloads are never averaged or altered.
With none of the parameters present, the response is byte-identical to before range queries existed — existing integrations are unaffected. With retention disabled (the default), passing any range parameter returns 400 with a message naming the key to set:
{"message":"metric history retention is disabled; set history_enabled (off by default) to use from/to/resolution","status":400}The field-by-field shape of every endpoint above — types, descriptions, privilege notes, query parameters — is generated, not hand-written, so it cannot drift from the code the way a transcribed table can:
docs/openapi.jsonis the OpenAPI 3.1 spec checked into this repo and the source of truth everything else below is built from. A CI check (TestOpenAPISpecCoversAllRegisteredRoutes) fails the build if a route registered inmain.gohas no matching entry here.GET /openapi.jsonserves that same file live from the running instance — point any OpenAPI-aware client generator at it for a free SDK in your language of choice.- The panel renders it at
/docs(client-side, from/openapi.json, so the page itself can never go stale independent of the spec).
Nitr reads its settings from config.ini in the working directory by default. Every setting can also be supplied as a NITR_ environment variable (uppercase, e.g. NITR_PORT, NITR_SAVE_LOGS, NITR_CORS_ORIGINS), which is what makes the Docker image configurable without bind-mounting a config file. Configuration resolves, highest priority first:
--flags>NITR_*environment variables > config file > built-in defaults
| Flag | Env var | Config key | Default |
|---|---|---|---|
--config |
NITR_CONFIG |
— | ./config.ini |
--port |
NITR_PORT |
port |
8000 |
--host / --bind |
NITR_BIND_ADDRESS |
bind_address |
0.0.0.0 (all interfaces) |
--data-dir |
NITR_DATA_DIR |
data_dir |
working directory |
--history-enabled |
NITR_HISTORY_ENABLED |
history_enabled |
false |
--history-interval |
NITR_HISTORY_INTERVAL |
history_interval |
10 (seconds) |
--history-retention-hours |
NITR_HISTORY_RETENTION_HOURS |
history_retention_hours |
24 (hours) |
--bind is accepted as an alias of --host. Keys without a dedicated flag — save_logs, cors_origins, metrics_push_interval, and the rest below — are still settable via their NITR_ env var.
The config file is named
config.inibut is parsed as YAML: writekey: valuelines, not INIkey=valueor[sections]— real INI syntax is silently ignored. The file keeps its.ininame rather than being renamed, to avoid breaking existing installs.
By default, the web server starts on port 8000.
port: 3000
The interface address the server listens on, via the bind_address key, the --host (or --bind) flag, or the NITR_BIND_ADDRESS env var. The default is 0.0.0.0 — all interfaces — which preserves the previous behaviour: the server always listened on every interface, and with nothing set it still does. Setting 127.0.0.1 makes localhost-only binding possible for the first time:
bind_address: 127.0.0.1
For a tool that exposes host telemetry, restricting it to loopback is a security-relevant capability — a loopback-bound server is not reachable from the network.
The directory holding nitr.db, via the data_dir key, the --data-dir flag, or the NITR_DATA_DIR env var. Defaults to the working directory. The directory is created if it does not exist.
data_dir: /var/lib/nitr
This relocates nitr.db and, when save_logs is on, nitr.log; config.ini is not affected and stays in the working directory (use --config to relocate it).
If true, opens your default web browser on server startup.
open_browser_on_startup: true
If true, logs are saved in nitr.log file, otherwise logs are printed out to console.
save_logs: true
If true, server starts using HTTPS protocol. Certificate and Key must be provided
ssl_enabled: true
ssl_certificate: /path/to/file.crt
ssl_certificate_key: /path/to/file.key
Per-client-IP request caps, in requests per minute. Exceeding one returns 429 Too Many Requests (see HTTP behaviour). Unset or invalid values fall back to the defaults.
rate_limit_login_max: 20
rate_limit_api_max: 300
Comma-separated list of browser origins allowed to call the server cross-origin. Empty (the default) denies all cross-origin browser access — see HTTP behaviour.
cors_origins: https://grafana.example.com, https://dash.example.com
Seconds between live CPU/RAM/disk pushes from the server to the web panel over the /status socket. Defaults to 3; values below 1 are clamped to 1.
metrics_push_interval: 3
Off by default. When enabled, nitr retains CPU, RAM, disk, and bandwidth samples in nitr.db, so the four usage-metric endpoints can answer time-range queries:
history_enabled: true
history_interval: 10            # seconds between retained samples
history_retention_hours: 24     # samples older than this are pruned
Why it defaults to off — this is a deliberate product decision, not an oversight: the sampler writes to nitr.db every history_interval seconds, and sustained small writes wear flash/SD storage. Raspberry Pi is an explicitly targeted deployment, so retention is strictly opt-in — understand that tradeoff before enabling it on an SBC.
At the defaults the database reaches a steady state of 8640 samples per metric (24h at 10s): all four metrics are written in a single transaction (one fsync per tick), pruning rides in the same transaction, and the file plateaus at that high-water size rather than growing without bound. With retention disabled, no history is ever written and nitr.db contains no history bucket.
Nitr publishes release binaries for Linux and Windows, on amd64, 386 (32-bit), and — Linux only — arm64:
| OS | amd64 | 386 | arm64 |
|---|---|---|---|
| Linux | yes | yes | yes |
| Windows | yes | yes | no |
Download them from the latest release.
Every push runs the full test suite on two CI runners — ubuntu-latest and windows-2025 — and on each leg additionally builds the real binary and runs nitr version, asserting it exits 0 and prints a sane version string. The 386 builds in the table above are cross-compiled by CI but are not executed there.
linux/arm64 (Raspberry Pi, Odroid, ARM VPS instances) is a supported, published target: CI cross-compiles it, a probe job executes the binary on a real ARM64 runner (ubuntu-24.04-arm) and verifies the endpoints, and nitr_linux_arm64 ships with the release artifacts. One caveat: endpoints that read SMBIOS/DMI — /api/v1/bios, /chassis, /baseboard, /product and /memory — depend on data most ARM single-board computers simply do not provide (a Raspberry Pi has no SMBIOS at all), so expect them to be empty or unavailable there. The CI probe runner is a cloud VM that does expose DMI, so its populated SMBIOS endpoints do not generalise to SBC hardware. That is a platform property, not a bug. The endpoints that matter most for monitoring — CPU, RAM, disk, network, host, processes — go through /proc and work.