Skip to content


Latest commit


History

87 Commits

Folders and files

NameName
Last commit message
Last commit date


Repository files navigation

A musical collaboration graph

Understanding musical collaborations via graph-based analysis

Visualization

Root dir: https://akashlevy.github.io/Musical-Collab-Graph/

  • graph.pickle : All scraped nodes
  • graph2.pickle : Nodes with degree > 1
  • graph3.pickle : Only Nodes actually scraped by algorithm
  • graph4.pickle : Scraped nodes with degree > 1
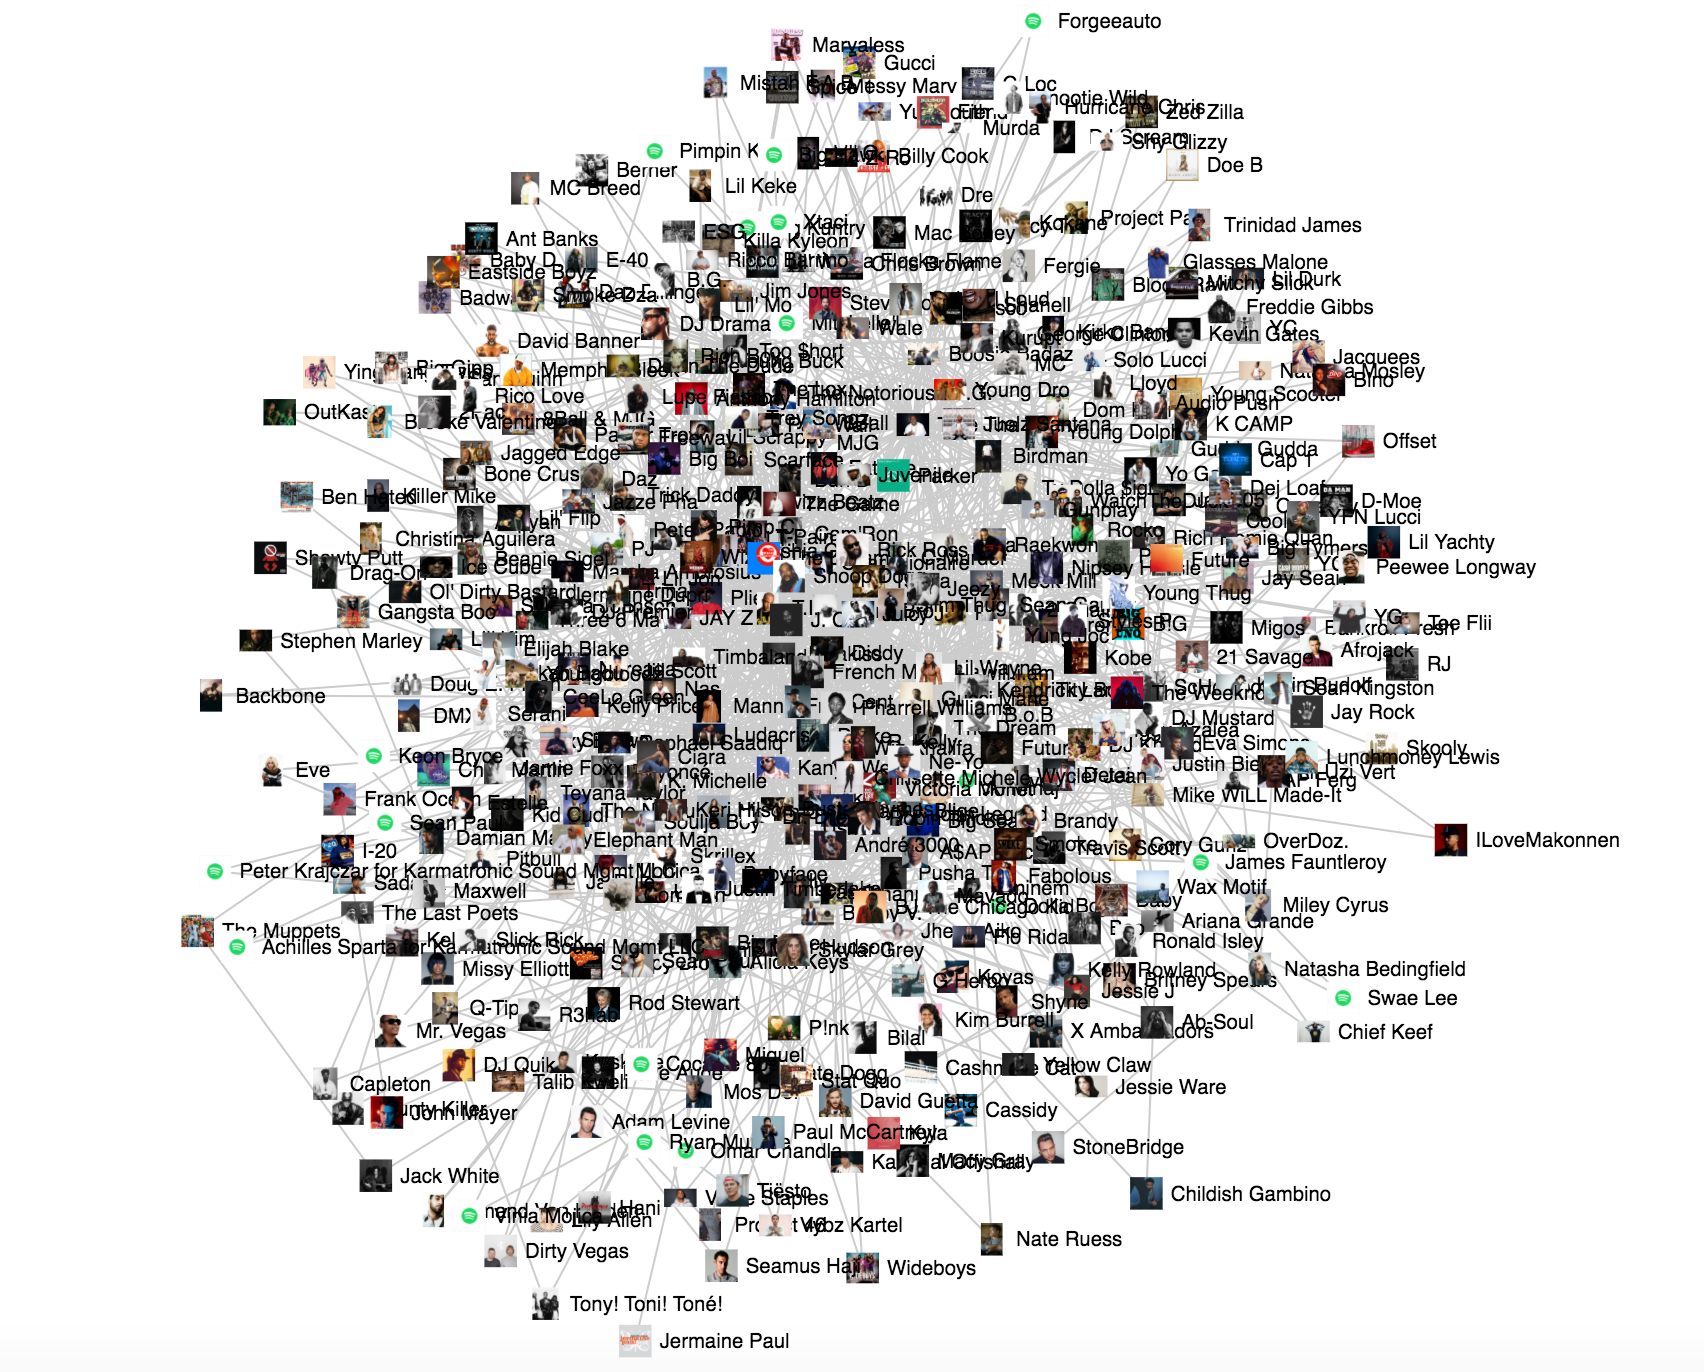
Visualization

Dependencies

Methodology

Song data is fetched from Spotify's web API

Graph analysis

  • (Erica) Calculate pagerank importance vectors, digraph based analysis
  • (Daniel) Hub/centrality measures, clustering coefficient
  • (Vincent) Metric based influence: Most collabs,
  • (Akash) Clique analysis / Almost fully connected

Visualization

  • Neo4J
  • (Akash) Options to search up selected cliques
  • (Sunny) Distance based plot from a starting node

About

Using Spotify's API, we created a massive digraph of musical collaborations between current top Pop artists. Using graph centrality measures and ranking algorithms such as PageRank and HITS, we measured the relative influence of each artist based on their importance in the musical collaboration network.

Resources

Stars

0 stars

Watchers

1 watching

Forks

Releases

Packages

Contributors

Languages