

LocalMetrics is a cross-platform proof of concept that collects CPU, memory, and disk usage from the machine where it runs. A single native ASP.NET Core process serves a real-time Blazor dashboard, a JSON API, and a Prometheus-compatible endpoint.
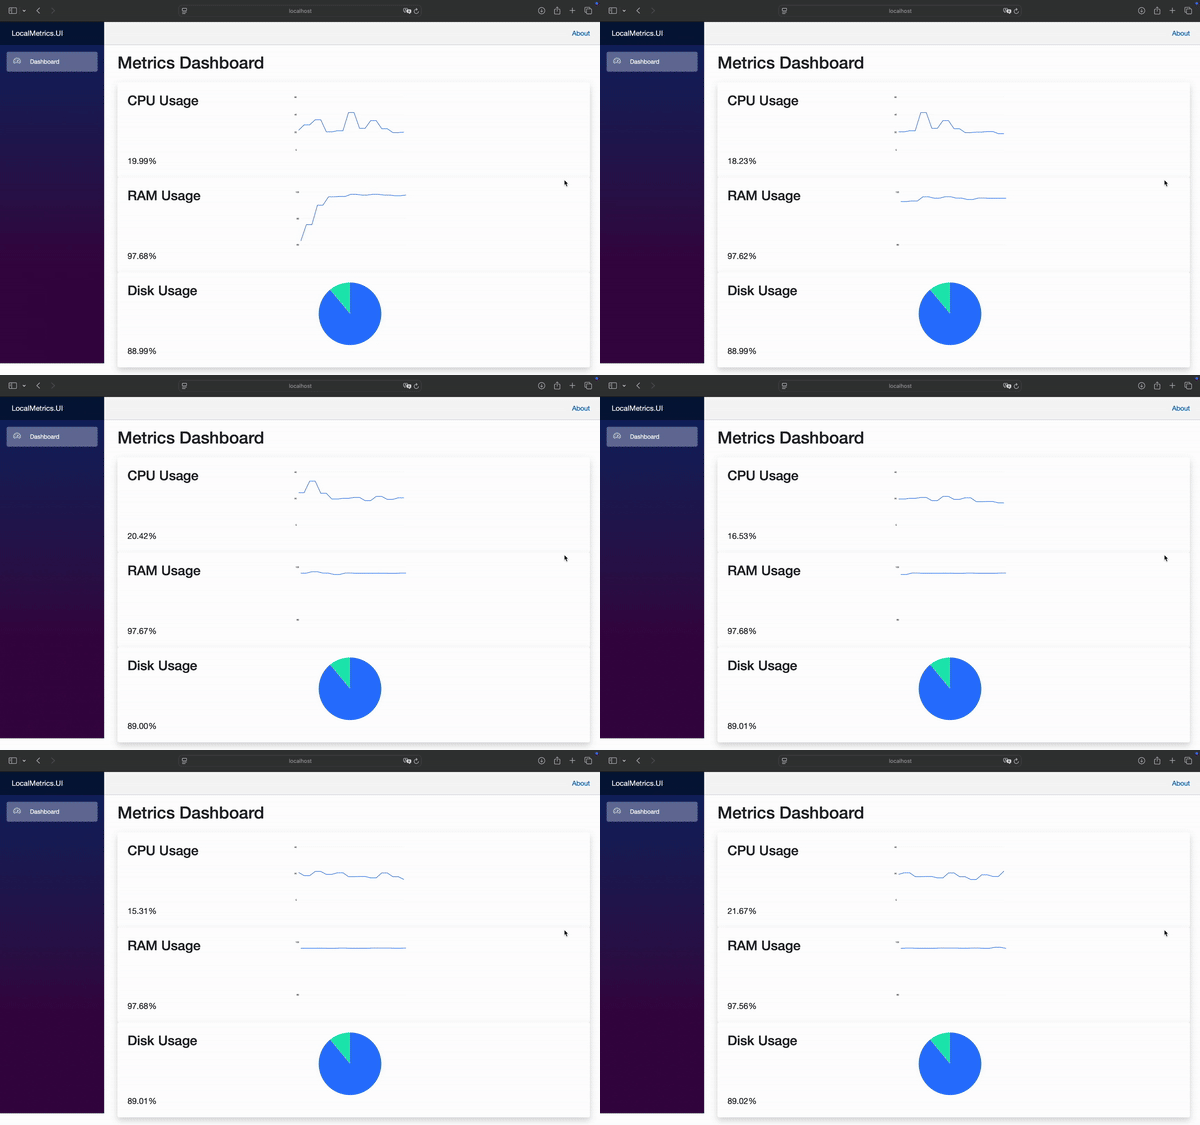
Original prototype running on macOS under load.
flowchart LR
    OS["Windows, Linux, or macOS"] --> Collector["Native platform collector"]
    Collector --> Cache["5-second in-memory cache"]
    Cache --> Host["ASP.NET Core host"]
    Host --> UI["Blazor dashboard"]
    Host --> JSON["JSON API"]
    Host --> Prometheus["Prometheus endpoint"]
    NGINX["Optional NGINX proxy"] --> Host
- Platform-specific collectors read host metrics through operating-system APIs and utilities.
SystemMetricsServiceshares a cached sample between every output.- The dashboard keeps a short in-memory history for its live charts.
- The core collection logic is isolated from the web host and covered by tests.
- NGINX remains an optional reverse-proxy example; metric collection always runs natively on the monitored machine.
Requirements:
- .NET 10 SDK, version 10.0.300 or newer
- Docker, only for the optional NGINX proxy
Start LocalMetrics on the machine you want to monitor:
dotnet run --project src/LocalMetrics.AppOpen http://localhost:5050.
To place NGINX in front of the native application, allow the proxy container to reach it:
dotnet run --project src/LocalMetrics.App -- --urls http://0.0.0.0:5050
docker compose up --build
Then open http://localhost. Use the container-accessible binding only on a trusted development machine with an appropriate firewall.
| Endpoint | Purpose |
|---|---|
GET /api/systemmetrics |
Current CPU, memory, and disk sample as JSON |
GET /metrics |
The same sample in Prometheus text format |
GET /swagger |
Interactive API documentation in Development |
dotnet test LocalMetrics.sln --configuration ReleaseGitHub Actions builds the solution, runs the tests, and exercises the native collector on Linux, Windows, and macOS.
LocalMetrics monitors one machine and intentionally keeps no historical telemetry. It is a focused demonstration of native cross-platform collection, ASP.NET Core API design, Prometheus integration, and a server-rendered Blazor interface—not a replacement for a production observability platform.
Contributions and bug reports are welcome through issues and pull requests.