Warning
[ARCHIVED] This project is no longer maintained and is read-only. It serves as a public archive.











| About Dataverse | Application Preview | Repository Structure | Installation |
|---|
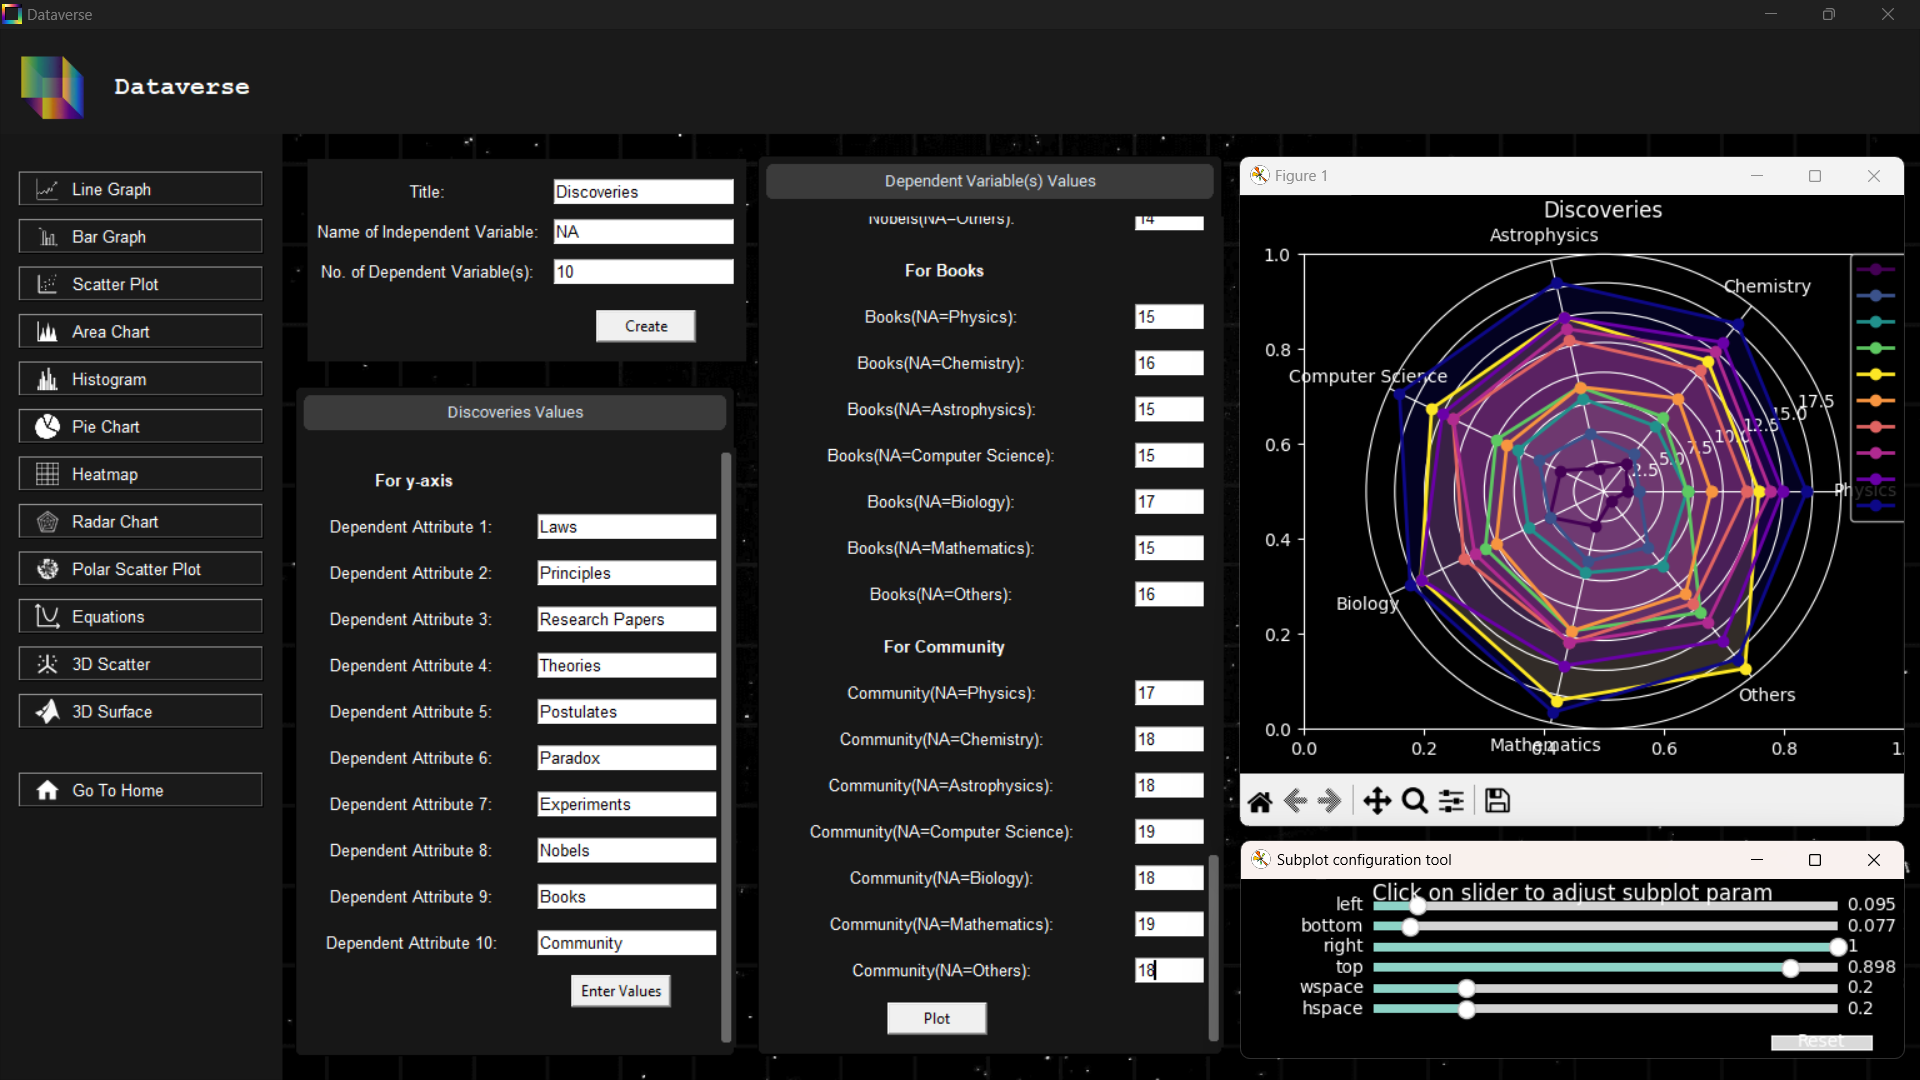
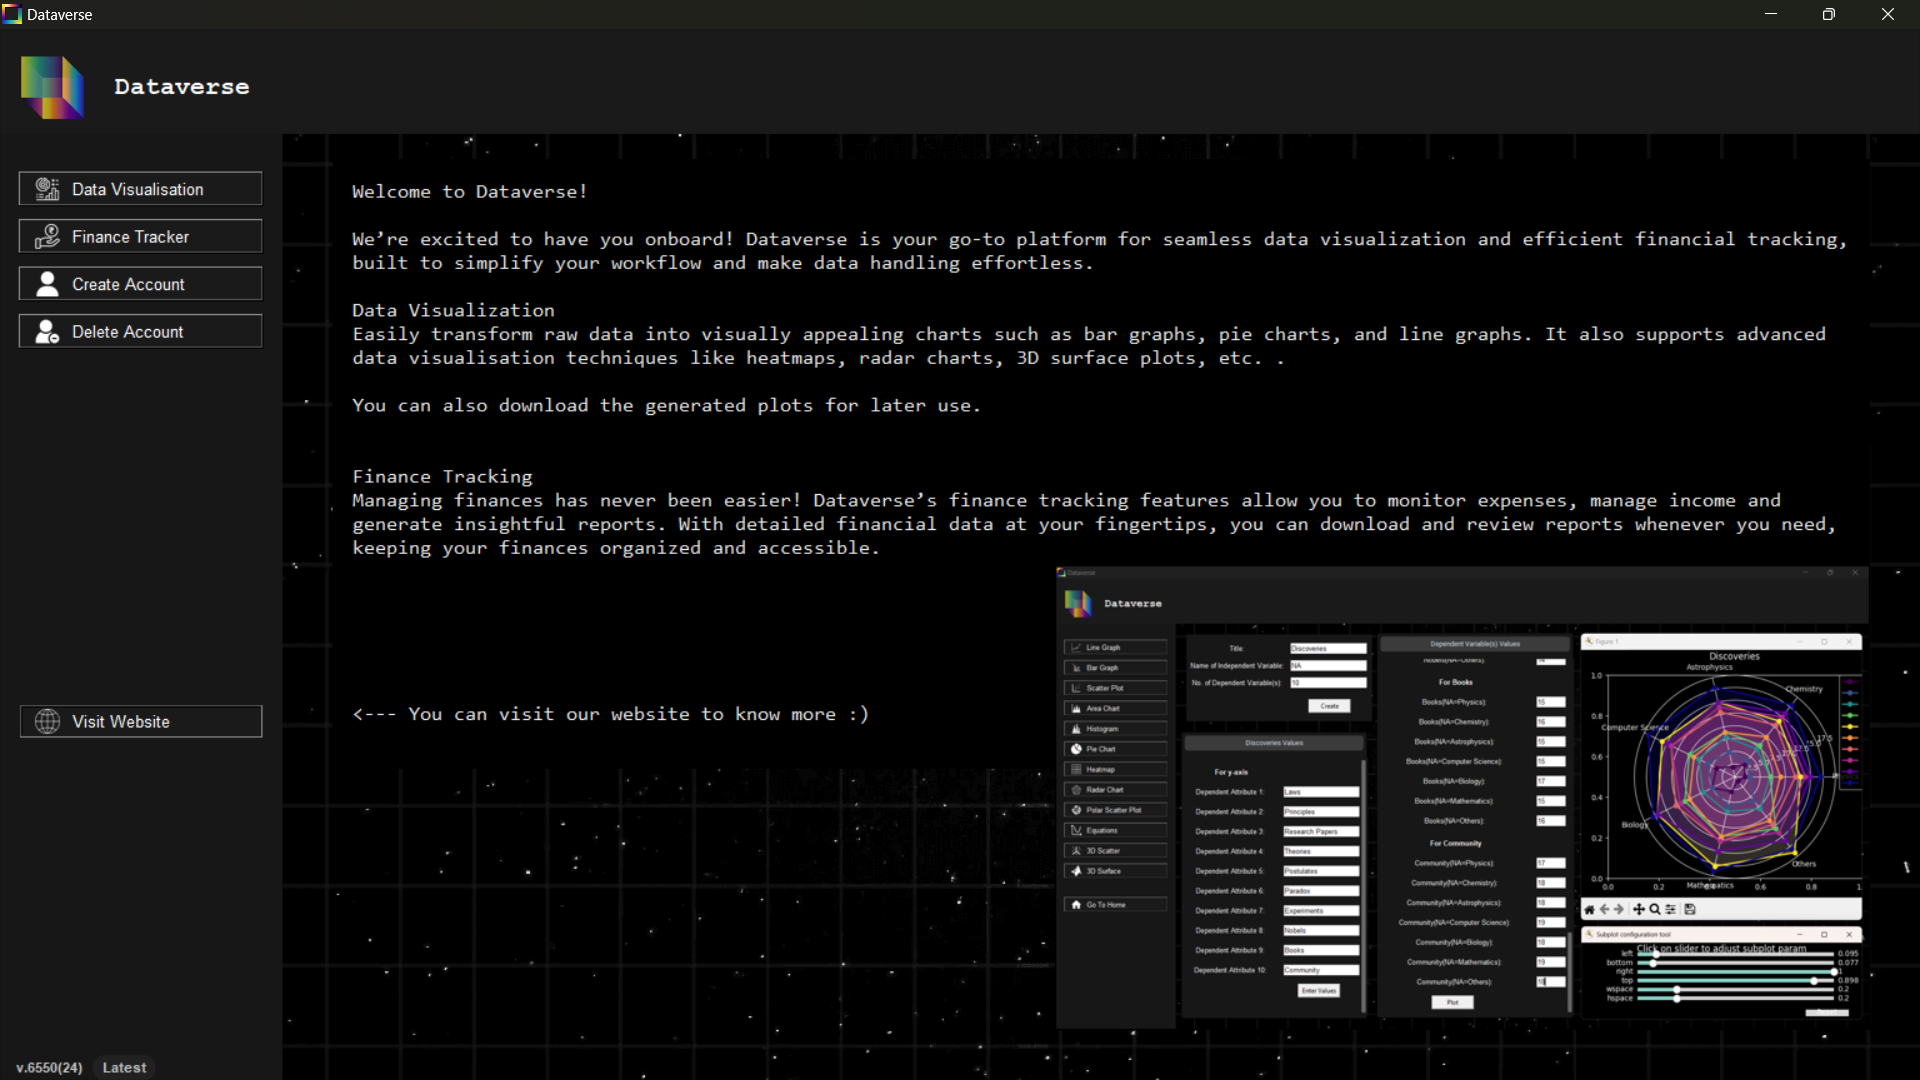
- Provides a graphical interface for generating Matplotlib charts.
- Supports visualizing datasets without writing Python code.
- Generates interactive, customizable and exportable graphs.
- Serves as a local tool for rapid data visualization.
| 📂 View Repository Structure |
|---|
A pre-compiled executable is provided for Windows users, eliminating the need to install Python or any dependencies.
- Go to the GitHub Releases page.
- Download the latest
Dataverse.exe. - Double click the
.exefile to run the application.
Note
If you prefer to run from source, you can clone the repository and run pip install -r requirements.txt followed by python software/main.py.
Now, the software should run smoothly with no errors. Enjoy visualizing your data!