


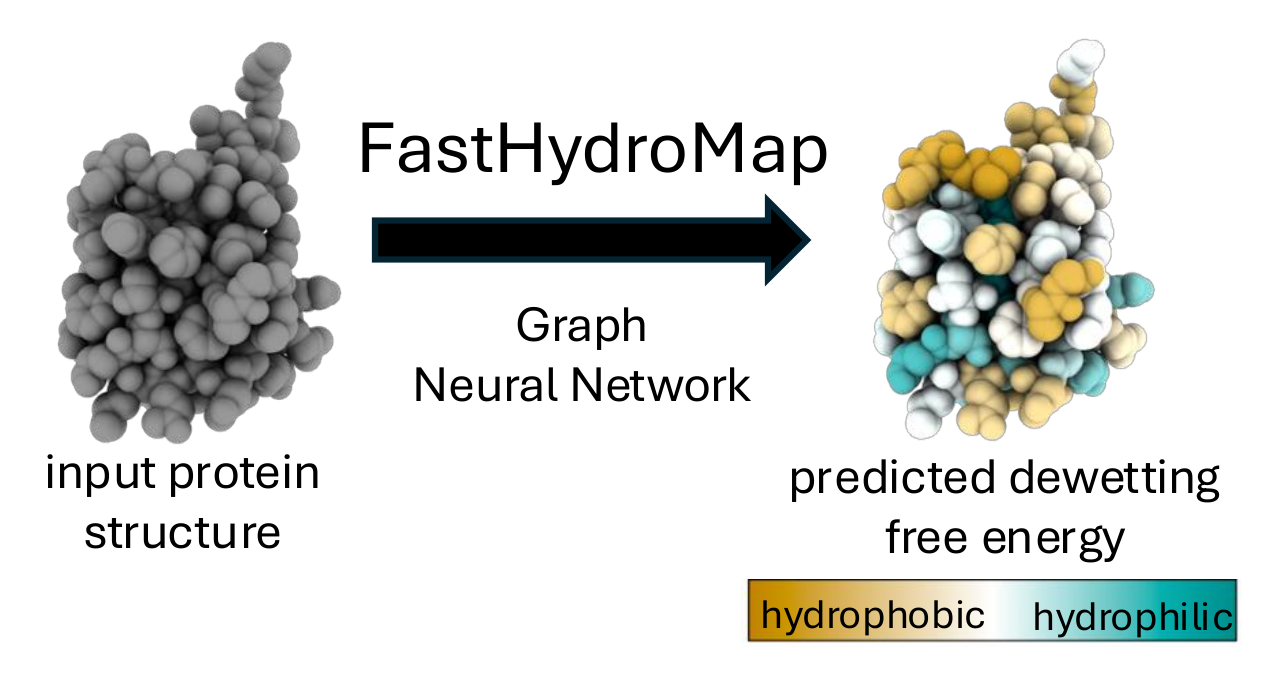
FastHydroMap predicts per-residue dewetting free energies (Fdewet) from protein structures and trajectories.
It can also predict water structuring (PC1, PC2, PC3 of the water triplet angle distribution).
Use a fresh Python environment. Python 3.11 to 3.14 are supported.
pip install fasthydromap
fasthydromap install-torch
fasthydromap predict your_structure.pdb -o outputs/your_structure_fdewet
fasthydromap install-torch defaults to the CPU build, which is usually the right choice for current FastHydroMap workloads because SASA preprocessing dominates runtime.
Advanced installation options, Docker usage, GPU Torch variants, and release workflows are documented in INSTALL.md and PYPI_RELEASE.md.
FastHydroMap supports:
- Single protein structures in
PDBformat - Protein trajectories in
DCDorXTCformat together with a matching topologyPDB
Typical usage:
# Single structure
fasthydromap predict examples/1A1U.pdb -o outputs/1A1U_fdewet
fasthydromap predict examples/1A1U.pdb --quantity pc1 -o outputs/1A1U_pc1

# Trajectory
fasthydromap predict-trajectory examples/proteinG.pdb examples/proteinG_short.dcd -o outputs/proteinG_fdewet
The default --quantity fdewet predicts dewetting free energy. Use --quantity pc1, --quantity pc2, or --quantity pc3 to predict water-structure principal-component maps instead.
For a single structure, FastHydroMap writes:
*.csv: one row per residue with the requested quantity; with--parts, intrinsic and context columns are included*.pdb: a copy of the input structure with the requested quantity written to B-factors
For a trajectory, FastHydroMap writes wide CSV files containing one row per frame and one column per residue.
Use --parts to also write intrinsic, context, and per-frame summary CSVs.
FastHydroMap was trained on structured single-chain proteins and the 20 canonical amino-acid chemistries. Predictions for PTMs and other non-canonical chemistries should be treated cautiously.
FastHydroMap writes predicted values to the B-factor column of output PDBs, so you can color structures directly in molecular viewers.
ChimeraX:
color bfactor range 4,6.5 palette ^lipophilicityExample PC map coloring in ChimeraX:
color bfactor range -8,8 palette red-white-blue # example range and palette for PC1: redder = more tetrahedral angles
color bfactor range -2,8 palette cyanmaroon # for PC2: maroon = more 90 deg angles (unstructured)
color bfactor range -2,2 palette ^lipophilicity # for PC3: yellower = fewer 50 deg angles (i.e. fewer highly coordinated waters)
PyMOL:
spectrum b, red_white_blue, minimum=4, maximum=6.5For dynamic hydrophobicity visualization in a MD trajectory, see the teaching-oriented example script
scripts/chimerax_fdewet_trajectory_example.py with a ChimeraX implementation you can adjust.
If you use FastHydroMap in your research, please cite the software release:
Lobo, S. FastHydroMap (Version 0.1.3) [Computer software]. Zenodo. https://doi.org/10.5281/zenodo.19744336
When the manuscript becomes available, please cite that as well.
Shell Lab and Shea Group