Modeling water-protein interactions to map local water structure, water-protein potential energy, and dewetting free energy.
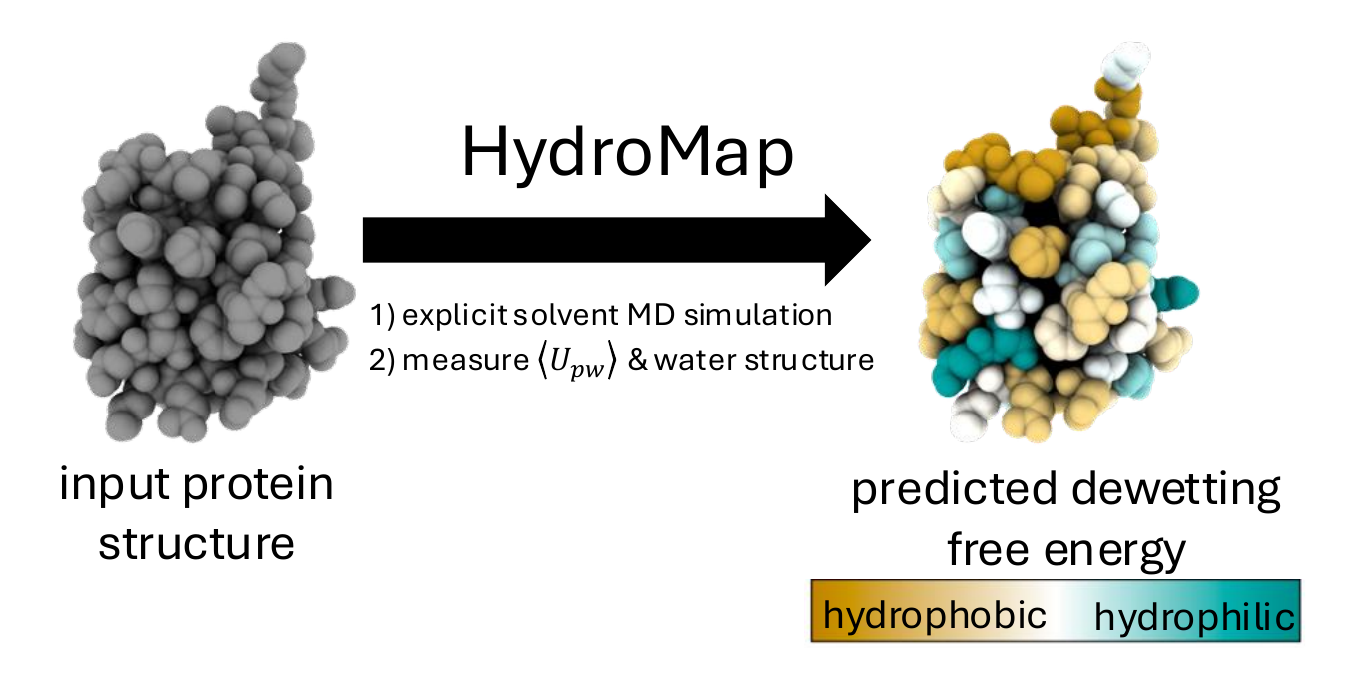
HydroMap maps local hydration around proteins from explicit-solvent molecular dynamics. For each residue (or user-defined group), it computes:
- water triplet-angle distributions (projected into PCs)
- water-protein interaction energies
- predicted dewetting free energy (
Fdewet)
Input
- protein structure file (pdb)
Output
- CSV with per-group features and predictions
- colored PDB files (properties in B-factor/tempfactor column)
- run artifacts under
artifacts/
For the most reproducible GPU installation, use Docker.
# build Docker image for GPU runs
docker build -f Dockerfile.gpu -t hydromap:gpu .

# verify the container and GPU runtime:
docker run --rm -it --gpus all --user "$(id -u):$(id -g)" -v "$(pwd)":/workspace/HydroMap hydromap:gpu hydromap --help
If your cluster blocks Docker daemon access, run the same images with Apptainer/Singularity: Apptainer user docs.
Docker quick start: Docker Get Started.
This is the main non-Docker alternative. If Docker works for you, prefer the Docker path above.
First clone the repository and enter it, since the editable install step below (pip install -e .) installs HydroMap from your local checkout:
git clone https://github.com/samlobe/HydroMap.git
cd HydroMap
Then create the pinned local GPU environment. environment.gpu.yml defines the tested Python 3.12 GPU stack:
conda install -y -n base -c conda-forge mamba
mamba env create -f environment.gpu.yml -n hydromap
conda activate hydromap
Then install HydroMap:
pip install -e .Then build the water-triplet C extension:
cd hydromap/triplets
python setup.py build_ext --inplace
python test_waterlib_compilation.py
cd ..
GPU verification:
python -m openmm.testInstallation
python tools/verify_gpu_install.py

python - <<'PY'
import openmm, MDAnalysis, yaml
import importlib.util
print('openmm', openmm.__version__)
print('MDAnalysis', MDAnalysis.__version__)
print('yaml', yaml.__version__)
print('pdbfixer installed:', importlib.util.find_spec('pdbfixer') is not None)
PY

hydromap --help
If CUDA checks fail, fix the environment or driver mismatch rather than falling back silently.
If you must deviate from environment.gpu.yml, make sure your OpenMM build, CUDA target, and NVIDIA driver are compatible. See the OpenMM installation guide and NVIDIA's CUDA compatibility documentation.
Run full pipeline:
hydromap run --config configs/example_gpu.yamlDocker equivalent (GPU):
docker run --rm -it --gpus all \
  --user "$(id -u):$(id -g)" \
  -v "$(pwd)":/workspace/HydroMap \
  -w /workspace/HydroMap \
  hydromap:gpu hydromap run --config configs/example_gpu.yaml
Run by stage:
hydromap prepare  --config configs/example_gpu.yaml
hydromap simulate --config configs/example_gpu.yaml
hydromap predict  --config configs/example_gpu.yaml
hydromap color    --config configs/example_gpu.yaml
hydromap analyze --config configs/example_external_trajectory.yamlFor most users, the settings that matter are:
- run setup:
input_dir,proteins/protein,seeds/seed - simulation length:
md.nanoseconds - restraints:
md.restrain_selection,md.restraint_k - grouping:
default is residue-by-residue within each chain; use
groups_filefor custom MDAnalysis selections - coloring and filtering:
analysis.min_waters,analysis.color_properties - external-trajectory mode:
analysis.existing_processed_pdb,analysis.existing_trajectory, optionalanalysis.existing_topologyHydroMap uses the processed PDB and trajectory for analysis. In this mode,proteinis used for output naming andinput_diris not used for structure loading. - prep safeguards:
md.repair_missing_atoms,md.capping_mode,md.prep_policy
Common advanced controls:
- sampling windows:
analysis.discard_initial_ns,analysis.tail_ns - frame sampling:
analysis.triplets_frame_stride,analysis.potentials_frame_stride - ion controls:
md.neutralize,md.ionic_strength_molar,md.positive_ion,md.negative_ion
For the full schema and advanced options, see configs/README.md.
If you already have an explicit-solvent PDB and matching trajectory, HydroMap can analyze them directly without running MD.
Set:
analysis.existing_processed_pdbanalysis.existing_trajectory- optional
analysis.existing_topology
Then run:
hydromap analyze --config <your_config>.yamlIf you also want predictions and colored PDBs:
hydromap run --stages analyze predict color --config <your_config>.yamlNote:
Fdewetpredictions and PC values are only meaningful for simulations run with thea99SBdispforce field.existing_topologycan be an OpenMMSystem.xmlor a GROMACS.top- if
existing_topologyis omitted, HydroMap will try rebuilding an OpenMM system ifforcefield: a99SBdisp
- Visualize your prepared system or trajectory in ChimeraX or PyMOL to confirm the solvation, ions, and overall geometry.
- If a protein fails during preparation, please leave a GitHub issue and include the input structure plus the HydroMap error output.
- In colored PDB outputs, gray atoms are usually ones HydroMap left at the pad B-factor (
-999by default), meaning that group was not colored, most commonly because it had fewer hydration waters than themin_waterscutoff (typically 7, i.e. the low end of the training data) or never received a property assignment/selection match. - General PTMs are not supported in the OpenMM preparation path.
- For prep behavior such as missing-atom repair, capping, strict/permissive prep policy, and
prepare_report.json, see configs/README.md. - For PC sign conventions and interpretation, see configs/README.md.
Common value ranges:
Fdewet:4.0to6.5PC1:-8to8PC2:-2to8PC3:2to-2
ChimeraX coloring commands:
Fdewet:color bfactor range 4.0,6.5 palette ^lipophilicity; color @@bfactor<-998 grayPC1:color bfactor range -8,8 palette red-white-blue; color @@bfactor<-998 grayPC2:color bfactor range -2,8 palette cyanmaroon; color @@bfactor<-998 grayPC3:color bfactor range -2,2 palette ^lipophilicity; color @@bfactor<-998 gray
PyMOL coloring commands:
Fdewet:spectrum b, red_white_blue, minimum=4.0, maximum=6.5; color gray, b<-998PC1:spectrum b, red_white_blue, minimum=-8, maximum=8; color gray, b<-998PC2:spectrum b, cyan_maroon, minimum=-2, maximum=8; color gray, b<-998PC3:spectrum b, red_white_blue, minimum=-2, maximum=2; color gray, b<-998
Shell Lab and Shea Group
UCSB CNSI for computing resources
Patel Group for INDUS used in model fitting
DE Shaw Group for a99SB-disp force field