Point
tracesat the session logs your coding agent already writes to disk: Claude Code, Codex, OpenCode, Gemini, and more. Get failure-mode and efficiency findings with zero instrumentation. A CLI and an SDK.
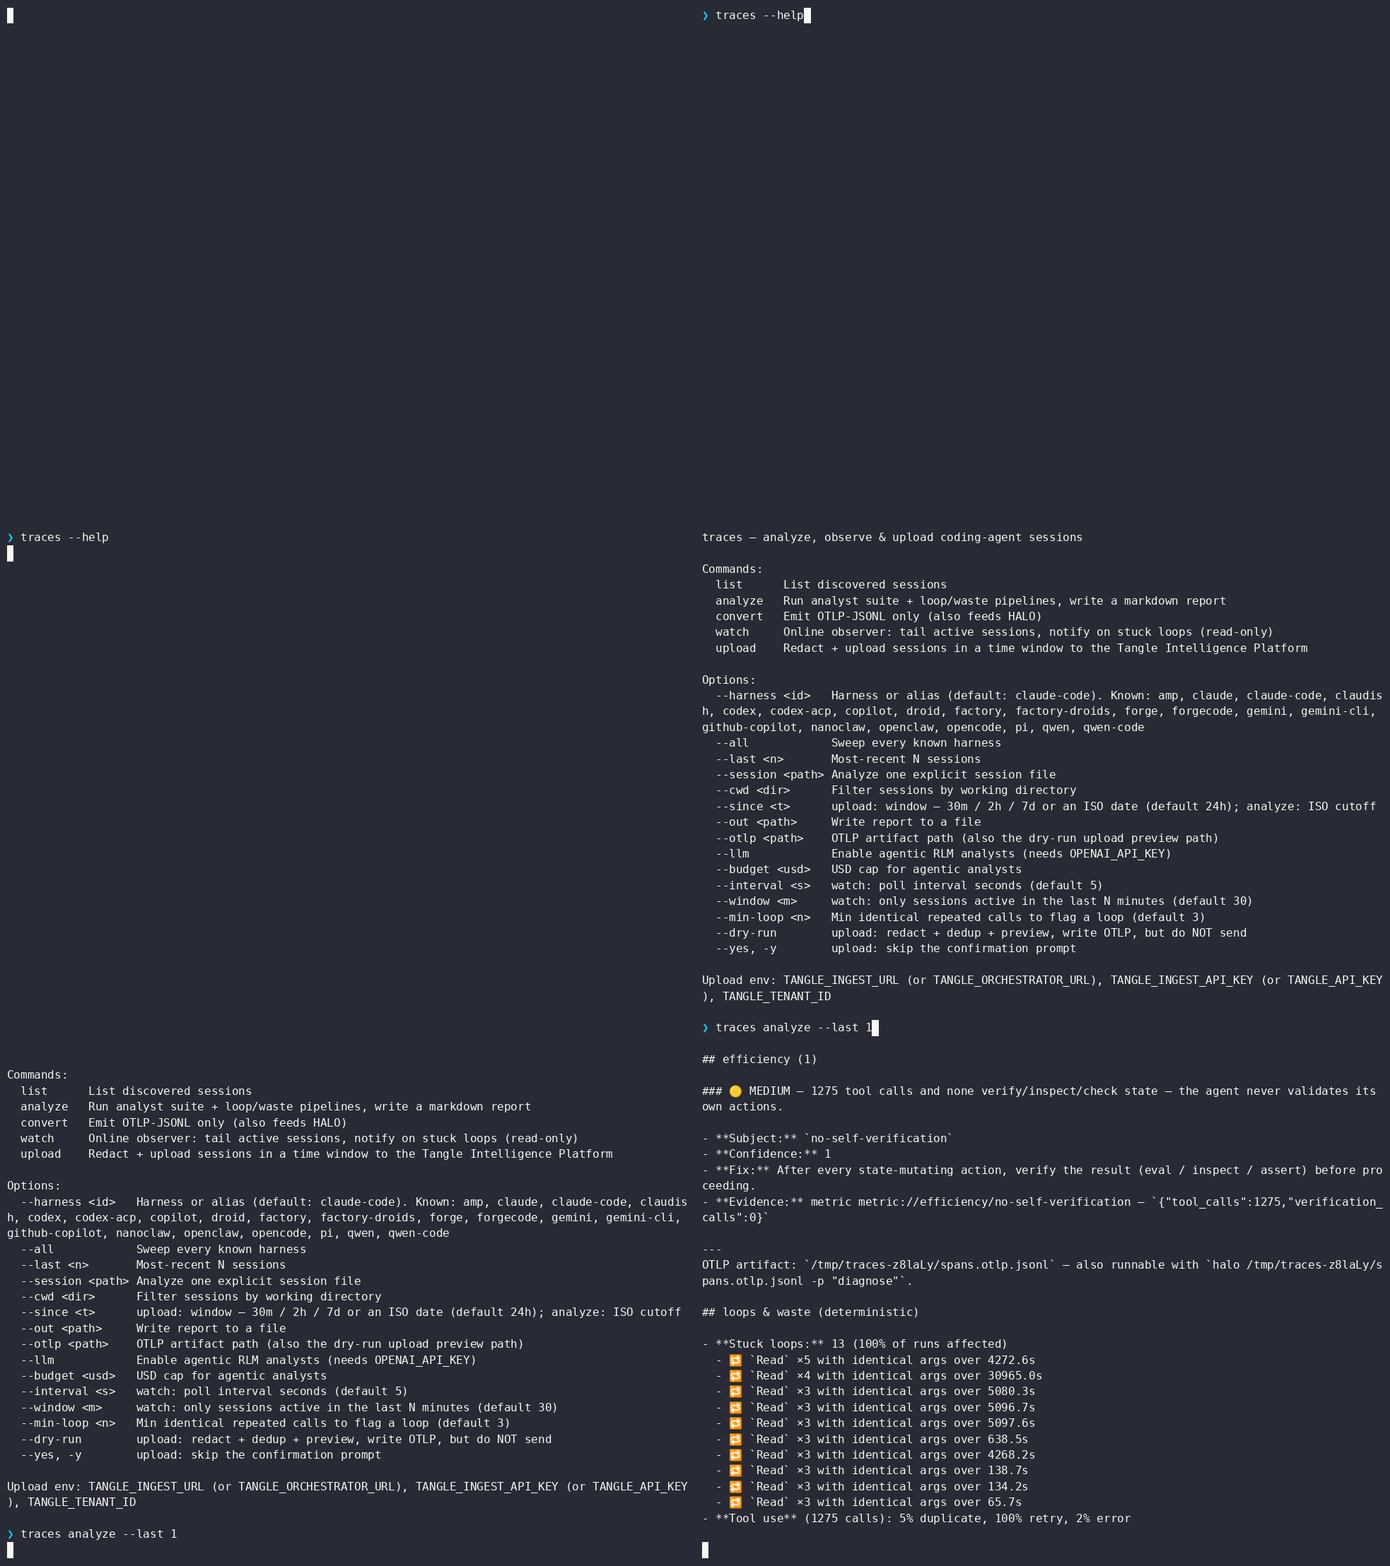


It reads the transcripts your harness leaves on disk, reconstructs the run as spans, and reports where the agent got stuck, burned tokens, or stopped checking its own work. The deterministic pass runs locally, with no API key and no cost.
- Install
- Quick start
- What it finds
- Supported harnesses
- CLI reference
- Live stream
- Improvement engine
- Session index
- Policy-mining evidence
- Upload to the Intelligence Platform
- Trace analysts
- Agent skills
- Library (SDK)
- Examples
- Develop
curl -fsSL https://raw.githubusercontent.com/tangle-network/traces/main/install.sh | bash
traces --version

npx --yes @tangle-network/traces@latest analyze --harness claude-code --last 1  # run without installing
npm i -g @tangle-network/traces                                           # install manually
npm i @tangle-network/traces                                              # use it as a library
Requires Node ≥ 22.
traces analyze --harness claude-code --last 1
traces improve --harness claude-code --last 5 --dir .traces/improvement
traces watch --all
traces stream --all --mode findings
The first command is shown in the demo above. The deterministic pass checks stuck loops, token growth, output decay, missing self-verification, tool failures, and human corrections. Each supported issue is returned as a finding with evidence, an action, confidence, and a validation plan. It needs no API key and costs nothing.
Add --llm for the agentic analysts. traces first uses free local signals to choose the smallest useful set: a failure review always runs, while knowledge and edit reviews run only when failures, repeated calls, or corrective feedback support them. They call OpenAI and respect --budget <usd>.
Every run also writes a canonical OpenInference JSONL artifact. Use it with HALO, Hodoscope, or any command that reads the file. See Trace analysts.
traces improve is the reviewable action path.
It writes one typed result, one report, flattened evidence rows, and the canonical OTLP trace.
Each finding already contains the claim, evidence, recommended action, confidence, and validation plan.
The deterministic pass (free, no key) surfaces:
| Finding | Meaning |
|---|---|
| Stuck loops | the same tool called N× with identical args and no state change |
| Monotonic input growth | full history re-sent every step; context never compressed |
| Output-length decay | planning/reasoning per step shrinking as context grows |
| No self-verification | state-mutating actions never followed by an eval/inspect/check |
| Tool mix / retry / error rates | repeated, retried, and failed tool calls |
--llm adds agentic analysts that read the conversation and cluster higher-order failure and improvement signals. They receive the compact deterministic findings first, then share their earlier findings with later analysts. With traces improve, the selected analysts and reasons are saved in result.json and the report, so another agent can reuse the packet without rereading the raw trace.
"Verified" = tested against real sessions; "fixture" = tested against schema-accurate fixtures (no real sessions available).
| Harness (aliases) | Reads from | Status |
|---|---|---|
claude-code (claude, claudish, openclaw, nanoclaw) |
~/.claude/projects/<cwd>/*.jsonl (+ subagent sidechains) |
verified |
codex (codex-acp) |
~/.codex/sessions/**/rollout-*.jsonl |
verified |
codex-exec (codex-json) |
explicit codex exec --json JSONL file |
fixture |
opencode |
~/.local/share/opencode/storage/ |
verified |
gemini (gemini-cli) |
~/.gemini/tmp/<hash>/chats/session-*.json |
verified |
pi |
~/.pi/agent/sessions/<cwd>/*.jsonl |
verified |
factory (factory-droids, droid) |
~/.factory/sessions/<cwd>/*.jsonl + .settings.json sidecar |
locate verified, parse fixture |
qwen (qwen-code) |
~/.qwen/projects/<cwd>/chats/*.jsonl |
fixture |
amp |
~/.local/share/amp/threads/T-*.json |
fixture |
github-copilot (copilot) |
~/.copilot/session-state/<id>/events.jsonl |
fixture |
forge (forgecode) |
/dump JSON exports |
fixture |
Every adapter captures the conversation stored in one session file: the user's prompt and the assistant's response text, plus tool calls/results and token usage.
Claude Code's nested subagent files are folded into the parent trace.
Codex stores each worker in a separate session file; add --workflow to resolve the connected coordinator and worker files.
github-copilot is the one exception: its log format carries no user prompt.
Factory stores token totals in .settings.json, not per turn.
Forge reads /dump JSON exports; live SQLite remains unsupported.
ACP-only bridges may not persist a local transcript.
traces list     --harness claude-code --last 20    # discover sessions
traces analyze  --harness codex --session <id>     # pin one ID printed by `list`
traces analyze  --harness codex --current          # this session, even when a child wrote later
traces analyze --harness codex --current --latest-turn --workflow  # current turn plus workers
traces analyze --harness claude-code --session <path> --latest-turn # latest task plus its subagents
traces investigate --all --last 10 --out report.md  # explicit investigation alias
traces improve --all --last 10 --dir .traces/improvement
traces analyze  --all --since 2026-06-18 --out report.md
traces convert  --harness claude-code --last 1 --otlp spans.jsonl   # OTLP only
traces index    --all --since 24h --out session-index.json
traces inspect  session-index.json --out inspection-report.md
traces evidence --harness codex --last 20 --out policy-evidence.jsonl
traces evidence --harness codex-exec --session /tmp/codex.jsonl --cwd "$PWD" --out policy-evidence.jsonl
traces export   policy-evidence.jsonl --out spans.openinference.jsonl
traces import-codetracebench verified.jsonl --trajectory-dir normalized --out traces --revision <40-or-64-character-hex>
traces watch    --all                              # live observer; loops + semantic findings
traces stream   --all --mode findings              # low-volume semantic feed
traces stream   --all --mode agent                 # findings + deterministic report events
traces stream   spans.openinference.jsonl --format openinference --no-spans
traces upload   --since 1h --dry-run               # redact + dedup + preview, no network
traces upload --since 24h # upload last day to the Intelligence Platform| Flag | Meaning |
|---|---|
--harness <id> |
Harness or alias (default: claude-code) |
--all |
Every known harness |
--last <n> |
Most-recent N sessions |
--current |
Active Codex session from CODEX_THREAD_ID |
--latest-turn |
Limit a resumed Codex or Claude Code session to its latest task turn |
--session <id|path> |
One listed session ID or explicit session file |
--workflow |
Expand selected files through stable parent and child session IDs |
--max-workflow-sessions <n> |
Stop workflow expansion before parsing more than n files; default 100 |
--cwd <dir> |
Filter by working directory |
--since <t> |
upload: window, 30m/2h/7d or ISO (default 24h); analyze: ISO cutoff |
--out <path> |
Write the report to a file |
--dir <path> |
improve: write the full artifact pack to this directory |
--otlp <path> |
OTLP artifact path (also evidence provenance / dry-run upload preview) |
--format <kind> |
File analyze, export, or stream: auto, policy-evidence, sandbox-events, openinference, intelligence-spans, or chat-trajectory |
--llm / --budget <usd> |
Enable agentic analysts (needs OPENAI_API_KEY) / cap their spend |
--config <path> |
analyze / investigate / improve / stream: load BYO analysts, live analysts, and external analyzers |
--interval <s> / --window <m> |
watch / live stream: poll seconds (default 5) / active-session window minutes (default 30) |
--min-loop <n> |
Identical repeated calls before flagging a loop (default 3) |
--mode <kind> |
stream: visualizer (spans + findings), findings (low-volume), or agent (findings + reports) |
--replay / --once |
stream: scan once, then exit |
--no-spans / --no-findings |
stream: suppress raw span rows / finding rows |
--no-content |
upload: send metadata only; strip all prompt/response text |
--dry-run / --yes |
upload: preview without sending / skip the confirm prompt |
traces watch is the human terminal view.
It prints repeated-tool loops and semantic findings while a coding agent is still running.
traces stream is the machine feed.
It emits newline-delimited JSON events that a dashboard, art visualizer, local watcher, or hosted product can consume without scraping terminal prose.
traces stream --all
traces stream --all --mode findings
traces stream --all --mode agent --config traces.config.mjs
traces stream spans.openinference.jsonl --format openinference --no-spans
Live streaming emits session, span, analysis_batch, finding, and tick events; --mode agent also emits report events.
The semantic findings currently cover repeated failing commands, verification churn without code/config changes, completion claims without later verification, and high tool-error rates.
Use --mode findings when you want the low-volume meaning layer; keep visualizer for real-time views that need motion, timing, and tool-call texture.
Use --mode agent when another agent needs deterministic loop/tool-use reports alongside the findings.
The same JSONL shape is used for live sessions and replayed trace files:

Custom online analysts use the same config file as investigate and improve:
export default {
  liveAnalysts: [{
    id: 'my-live-rule',
    analyze(context) {
      return context.actions.some((action) => action.kind === 'claim') ? [{
        schemaVersion: 1,
        kind: 'traces.live_finding',
        id: `live.my-live-rule.${context.session.sessionId}`,
        ruleId: 'my-live-rule',
        fingerprint: `my-live-rule.${context.session.sessionId}`,
        severity: 'info',
        title: 'Completion claim seen',
        claim: 'A claim-like assistant message appeared in the live trace.',
        action: 'Require the next stream batch to include a verification action.',
        check: 'A later finding or batch should show a test/build/typecheck action.',
        evidence: [{ kind: 'metric', label: 'actions', value: String(context.actions.length) }],
        session: context.session,
        observedAt: context.generatedAt,
      }] : []
    },
  }],
}traces improve turns observed sessions into a portable improvement packet:
traces improve --all --last 20 --dir .traces/improvementThe directory contains:
| File | Purpose |
|---|---|
result.json |
findings, actions, checks, execution facts, adoption data, and the chosen LLM analysis route |
evidence.jsonl |
one row per evidence ref, suitable for downstream mining |
report.md |
human-readable report rendered from the typed data |
traces.otlp.jsonl |
canonical trace used by the analysts and execution accounting |
Bring your own analysts with a config file:
traces improve --last 5 --config examples/improvement-config.mjs --dir .traces/improvementThe config can export:
analysts: deterministic or LLM analysts that implement theagent-evalAnalystcontractliveAnalysts: deterministic online analysts that implement theTraceLiveAnalystcontract fortraces streamregistry: a prebuiltAnalystRegistryexternalAnalyzers: HALO or any command/model adapter that reads the OTLP artifact
Traces does not pretend that an action is a measured candidate.
Use agent-eval to propose and compare candidate changes, agent-runtime to package an approved improvement, and agent-interface to represent profile edits.
traces index writes one general JSON catalog over the selected sessions.
It is meant for deeper investigation and joins with other local data, not for one specific workflow.
traces index --all --since 24h --out session-index.json
traces inspect session-index.json --out inspection-report.md
The index contains:
- selection metadata and aggregate totals
- one row per session with harness, session id, path, cwd, repo labels, and time bounds
- behavior metrics: spans, LLM turns, tool calls, tool errors, tokens, models, and tools
- signal summaries: stuck loops and tool error rate
- nearby context files for joins:
AGENTS.md,CLAUDE.md, and.evolveJSONL / reflection artifacts, with markdown heading/ToC and JSONL key summaries
traces inspect reads that index back and prints ranked improvement findings over the sessions and nearby context.
It is intentionally read-only: it points to repeated-call loops, high tool-error sessions, missing repo attribution, long docs without Contents, invalid JSONL rows, and skill-run rows that cannot be joined back to a session.
traces does not emit benchmark campaign cells. It emits normalized coding-agent session evidence that another system can mine.
traces evidence --all --since 24h --out policy-evidence.jsonl --otlp spans.otlp.jsonl--last follows recent file activity and may select a child session in multi-agent work.
Use --harness codex --current --latest-turn --workflow for the invoking Codex turn plus its connected workers.
Omit --latest-turn when the full history of a resumed session is the intended unit.
Workflow expansion follows session IDs, never timestamps or worker names.
For a latest Codex child, it selects the last parent task that structurally spawned or targeted that child ID, then includes only workers referenced by that parent task.
This requires the parent log to record the child ID on a spawn, send, follow-up, or lifecycle event and to associate that event with a stable turn ID.
If either field is absent, the workflow is reported incomplete instead of widening to the parent's full history.
Missing files, duplicate IDs, contradictory parents, and cycles are reported explicitly.
Claude Code subagent files are already folded into their parent trace, so --workflow normally resolves one Claude session file.
With --latest-turn, ordinary Claude subagents are selected by their parent tool call ID.
Claude Workflow subagents are selected by the run ID and transcript directory returned by the parent Workflow call.
Each Workflow child attaches to the latest matching call that started before the child.
Task selection then keeps only children attached to calls in that task.
Returned directories from another resumed Claude session are included in parsing and source hashes.
Missing or conflicting Workflow identities stop the parse instead of widening the selected history.
Cross-harness parent/child trees are not inferred.
For a reproducible report, run traces list first and pass its session ID with --session.
Ephemeral codex exec --json output has no discovery location, so select its file with --harness codex-exec --session <path>.
The adapter rejects empty, incomplete, or other JSONL formats instead of emitting zero-valued session evidence.
Each JSONL row is one session:
- session provenance: harness, session id, cwd, path, mtime
- explicit-session source binding:
provenance.sourceSha256over every adapter-declared input file, including Claude worker and metadata files - repo labels:
tangle.subject.key,git.repository, branch, commit - behavior metrics: span counts, LLM turns, tool calls, errored tool calls, tokens, models, tool histogram
- mining signals: stuck loops and tool error rate
- provenance marker:
notCampaignCell: true
That boundary matters. agent-lab campaign cells.jsonl says "arm X beat arm Y on task Z." traces evidence says "this real agent session had this repo/model/tool/failure shape." A downstream policy compiler can cluster these rows, propose candidate policies, then validate those policies in a separate eval campaign.
If you already have compact evidence or event captures on disk, convert them to the same OpenInference JSONL shape that traces analyze --analyzer halo uses:
traces export policy-evidence.jsonl --out spans.openinference.jsonl
traces export sandbox-events.json --format sandbox-events --out spans.openinference.jsonl
traces export trajectory.json --format chat-trajectory --out spans.openinference.jsonl
halo spans.openinference.jsonl --prompt "Analyze this trace slice" --max-turns 1
traces export accepts:
- compact
traces.policy_evidence.sessionJSONL fromtraces evidence - JSON arrays with
start,raw,result,done, anderrorevents - existing OpenInference JSONL, rewritten through the local redaction path
- chat message arrays and objects with a
messagesarray
Run traces export --help for the full command reference.
upload redacts locally before anything leaves the machine, dedups against already-uploaded sessions, and tags each with metadata (harness, cwd, git branch, host).
traces upload --since 24h --dry-run     # see exactly what would be sent; no network
traces upload --since 24h --no-content  # send metadata only; drop all prompt/response text
traces upload --since 24h               # send it
It needs TANGLE_INGEST_URL (or TANGLE_ORCHESTRATOR_URL), TANGLE_INGEST_API_KEY (or TANGLE_API_KEY), and TANGLE_TENANT_ID. Without them, --dry-run still works fully.
Redaction is best-effort regex for structured secrets and credentials: API keys, GitHub/cloud tokens, JWTs, bearer headers, private-key blocks, KEY=secret assignments, and credentials embedded in URLs. It runs over every span attribute, including the captured prompt/response text.
It does not catch free-form PII such as names, postal addresses, or phone numbers in prose. Those need a context-aware model. Three postures, strongest first:
--no-content: upload metadata only (tool calls, tokens, timing, loop signal); no prose leaves the machine.- Run an ML PII scrubber (e.g.
openai/privacy-filter) on the platform ingest side as defense-in-depth. - Default: regex redaction of structured secrets.
Always --dry-run first to see exactly what would be sent.
Use the local checks by default. Add a model-backed engine only when the question needs semantic judgment or behavior discovery.
traces analyze --last 1
traces analyze --last 1 --llm --budget 0.50
traces analyze --last 1 --analyzer halo --analyzer-prompt "find token waste"
traces analyze --all --last 20 --analyzer hodoscope
traces analyze --last 1 --analyzer my-installed-command
HALO returns a diagnosis report.
Hodoscope samples distinct behaviors and marks every sample needs_review.
An arbitrary command returns a raw report unless its SDK adapter explicitly parses a stricter output type.
Read Trace analysts for the output contract, a minimal custom analyst, and labeled benchmark setup.
Redactors scrub prompt/response prose with an external PII model (catching names/addresses the regex pass can't), running after the built-in redaction:
# the command reads a JSON array of strings on stdin, writes the scrubbed array on stdout
traces upload --since 24h --dry-run --redactor "my-pii-scrubber"
In the SDK these are the ExternalAnalyzer and Redactor interfaces (haloAnalyzer, hodoscopeAnalyzer, commandAnalyzer, commandRedactor, applyRedactor, runExternalAnalyzers).
See examples/external-engines.ts.
For the built-in agentic analysts (
--llm), setOPENAI_API_KEY, or point at any OpenAI-compatible gateway withOPENAI_BASE_URL(e.g. an internal router) to use a non-OpenAI key.
The npm package ships two AgentProfile-ready skills:
| Skill | Use |
|---|---|
inspect-agent-traces |
select workflows and export deterministic findings |
build-trace-analyst |
write and calibrate a custom analyst |
Load both from GitHub:
import { defineGitHubResource } from '@tangle-network/agent-interface'

const ref = process.env.TRACES_SKILLS_REF
if (!ref) throw new Error('TRACES_SKILLS_REF must be an immutable commit')

const names = ['inspect-agent-traces', 'build-trace-analyst']
const skills = names.map((name) => defineGitHubResource(`skills/${name}/SKILL.md`, {
  repository: 'tangle-network/traces',
  ref,
  name,
}))
const profile = { name: 'trace-reviewer', resources: { skills } }Merging to main publishes a patch release automatically:
- The Publish workflow bumps
package.jsonfromX.Y.ZtoX.Y.(Z+1). - It commits
chore(release): vX.Y.(Z+1) [skip release]back tomain. - It pushes the matching
vX.Y.(Z+1)tag. - The same workflow verifies the tag, builds, publishes to npm, and creates a GitHub release.
pnpm check:packageproves the npm tarball contains thetracesbinary before release.
Minor releases are manual. Run the Publish workflow from GitHub Actions and choose minor; it publishes X.(Y+1).0. Use manual patch only when you need a patch release without merging a new code change.
The CLI is a thin consumer of these exports.
| Export | Signature | Use |
|---|---|---|
analyzeSpans |
(spans, { registry?, ai?, budgetUsd? }) → AnalyzeResult |
run built-in analysts, or your own via registry |
runTraceInvestigation |
(TraceInvestigationOptions) → TraceInvestigationResult |
typed findings with actions/checks, execution facts, external analyzer output, and report |
runTraceImprovement |
(TraceImprovementOptions) → TraceImprovementResult |
writes the full findings, evidence, report, and trace artifact pack |
buildTraceFindingPacket |
({ findings }) → TraceFindingPacket |
render any AnalystFinding[] without changing its schema |
runTraceStoreInvestigation |
({ traceStore }) → TraceStoreInvestigationResult |
run the same packet layer over a hosted/custom TraceAnalysisStore |
loadTracesConfig |
(path?) → TracesConfig | undefined |
load BYO analysts and external analyzers |
watchSessions |
(ObserverOptions) → Promise<void> |
live observer; onLoop / onReport / signal / adapters |
streamSessions |
(TraceStreamOptions) → Promise<void> |
live JSONL-ready event stream over active sessions |
traceStreamEventsFromSpans |
(spans, opts?) → TraceStreamEvent[] |
replay an existing span list as stream events |
analyzeLiveBatch |
(spans, opts?) → TraceLiveBatch |
compute semantic online findings for one batch |
classifyLiveActions |
(spans) → TraceLiveAction[] |
classify spans once as read/edit/verify/claim/tool/other |
defaultTraceLiveAnalysts |
TraceLiveAnalyst[] |
the built-in online analysts; extend or replace them |
collectSessionIndex |
(ScanOptions) → TraceSessionIndex |
scan sessions and return a reusable JSON-ready catalog |
inspectSessionIndex |
(TraceSessionIndex) → TraceInspectionReport |
rank improvement findings from an index without rescanning sessions |
buildPolicyEvidenceRecord |
(ref, spans, opts?) → PolicyEvidenceRecord |
summarize one session for downstream policy mining |
collectPolicyEvidence |
(ScanOptions) → PolicyEvidenceRecord[] |
scan harness sessions and emit policy-evidence rows |
collectSessionWorkflow |
(adapter, seeds, opts?) → SessionWorkflow |
resolve a bounded parent/child session tree with explicit relationship issues |
collectSessionSelection |
(groups, opts?) → SessionSelection |
parse, expand, and optionally byte-bind selected session groups |
exportTraceEvidenceFile |
(path, opts?) → { format, spans, redactionCount } |
convert compact evidence/events/OpenInference files to redacted OpenInference spans |
scanSessions |
(ScanOptions) → AsyncIterable<ScannedSession> |
the shared locate→parse iterator |
collectSessions |
(CollectOptions) → SessionBatch[] |
redacted per-session batches for your own pipeline |
redactSpans |
(spans, rules?) → { spans, report } |
PII/secret redaction (TRACES_REDACTION_RULES) |
planUpload / executeUpload |
(…, { backend? }) → … |
redact + dedup + send to any sink |
selectAdapters / listAdapters / resolveAdapter |
adapter selection + the harness registry | |
HarnessTraceAdapter |
interface (locate + parse) |
implement to add a harness |
ExternalAnalyzer / Redactor |
haloAnalyzer / hodoscopeAnalyzer / commandAnalyzer / commandRedactor |
drive engines/models you install |
import { watchSessions, streamSessions, analyzeSpans, AnalystRegistry, makeFinding } from '@tangle-network/traces'

// Observe live sessions, feed findings anywhere (read-only, cancellable):
const c = new AbortController()
await watchSessions({ all: true, signal: c.signal, onLoop: (l) => alert(l.toolName, l.occurrences) })

// Feed a visualizer or dashboard:
await streamSessions({ all: true, signal: c.signal, includeSpans: false, onEvent: (event) => console.log(event) })

// Run your own analyst instead of the built-ins:
const registry = new AnalystRegistry()
registry.register({
  id: 'mine', description: '…', inputKind: 'trace-store', cost: { kind: 'deterministic' }, version: '1.0.0',
  async analyze() {
    return [makeFinding({ analyst_id: 'mine', area: 'custom', claim: '…', severity: 'info', evidence_refs: [], confidence: 0.9 })]
  },
})
await analyzeSpans(spans, { registry })Runnable, in examples/:
| File | Shows |
|---|---|
observe-and-alert.ts |
tail live sessions and alert on stuck loops |
custom-analyst.ts |
register and run your own analyst |
improvement-config.mjs |
plug in BYO analysts for traces stream / traces improve |
custom-backend.ts |
redact + dedup + upload to your own sink |
register-harness.ts |
add a new harness by implementing HarnessTraceAdapter |
external-engines.ts |
drive HALO, Hodoscope, and an external PII scrubber |
pnpm install
pnpm dev analyze --harness claude-code --last 1   # run from source via tsx
pnpm test
pnpm typecheck
pnpm build        # dist/index.js (SDK) + dist/cli.js (bin) + .d.ts